Received: November 27, 2014
Accepted: February 2, 2015
Mediterr J Hematol Infect Dis 2015, 7(1): e2015022, DOI 10.4084/MJHID.2015.022
This article is available on PDF format at:

Elahe Bordbar1, Mehdi Taghipour1 and Beth E. Zucconi2
1 MD, General practitioner, Shiraz University of Medical Sciences.
2 PhD, Department of Pharmacology & Molecular Sciences, Johns Hopkins School of Medicine
| This is an Open Access article distributed
under the terms of the Creative Commons Attribution License (http://creativecommons.org/licenses/by/2.0), which permits unrestricted use, distribution, and reproduction in any medium, provided the original work is properly cited. |
|
Abstract Objective: Different indices
and formulas of CBC parameters have been suggested as indicators of
early stage screenings to detect couples with β-thalassemia minor
(BTMi). In this study, we evaluated the accuracy of five previous
published formulas and compared them to our new formula
(│80-MCV│×│27-MCH│) in screening of β-thalassemia. Methods: All couples in the premarital β-thalassemia screening program of Roodbar, Iran, for whom molecular analysis had been done, were selected during two years. The red blood cell parameters were applied to each formula, and a ROC curve was plotted for each one to check its discriminative effectiveness in β-thalassemia detection. Result: None of the studied indices and formulas demonstrated 100% precision. However, we found that the Shine–Lal formula and our formula had the highest sensitivity in identifying BTMi individuals. The highest specificity belonged to our formula and Sirdah formula. Conclusion: Previous studies reported different sensitivities and specificities for the formulas. This can be attributed to different kinds of HBB gene mutations in various populations. Undoubtedly, physicians in different areas should evaluate the accuracy of published formulas for their own populations in the discrimination of BTMi from other causes of microcytic hypochromic anemia |
Introduction
β-thalassemia major is a disaster that affects both patients and
their β-thalassemia carrier parents. β-thalassemia is widespread from
the Mediterranean area to Southeast Asia. Approximately 1.5 % of
world’s population are carriers of the associated genetic mutation and
60000 symptomatic individual born annually.[1] In Iran, the gene frequency of β-thalassemia is high and greatly variable in different areas.[2]
The highest rate of the carriers reported was about 10% around both the
Caspian Sea and the Persian Gulf. In other areas the prevalence is
between 4% and 8%.[3] About 3-5 % of Iranian population is heterozygous for the HBB gene.[4]
Carriers of β-thalassemia are usually clinically asymptomatic.[5]
However, they have typical characteristics of microcytic and
hypochromic anemia in their laboratory data. Their CBCs show mean
corpuscular volume (MCV) less than 80 fl and mean corpuscular
hemoglobin (MCH) less than 27 pg.[6] Although carriers
seem healthy, if both parents are β-thalassemia carriers, one-fourth of
their children may develop β-thalassemia major according to pure
Mendelian genetics.[7] Prenatal diagnosis is a feasible policy to prevent the birth of β-thalassemia major newborns.[8-10]
This strategy requires a powerful screening test for β-thalassemia
traits to identify couples at risk of having a fetus with β-thalassemia
major. Because screening should be done for all who want to conceive,
the method should be simple and highly sensitive.[11] Mass screening programs, especially in developing countries where resources are limited, should be cost effective.
Due to low cost of checking CBC, red cell parameters have been used as first indicators of possible β-thalassemia minor (BTMi).[4]
Not only have MCV and MCH values been shown to be highly inaccurate
predictors of parental genotype, but also multiple cut off points
(between 70-80 for MCV and 20-30 for MCH) have been reported.[12]
This mandates the development of more accurate indices and formulas.
Since the early 1970s, different indices and formulas of CBC parameters
have been suggested as easy and inexpensive tools to determine whether
an individual is in danger of developing BTMi or not. (England &
Fraser, 1973; Mentzer, 1973; Lafferty et al., 1996). However these
formulas have various accuracies reported in different studies.[13]
In
this study we want to evaluate the accuracy of some previous published
formulas and our new formula (│80-MCV│×│27-MCH│) to differentiate BTMi
from other causes of microcytic hypochromic anemia in Iranian
population.
Materials and methods
The samples of this study were collected from couples who were
referred for the premarital screening program of β-thalassemia in
Roodbar, Iran, a city located south of Kerman. This screening program
was started about 20 years ago under full control and supervision of
the Iranian Ministry of Health.[14] The method of screening was described in details in previous studies.[15]
For
the present study all couples, to whom molecular analysis had been done
and the exact genotype was confirmed (no mutation, β, α or sickle cell
mutations), were selected from Roodbar since April 2011 till March
2013. According to their medical records, the CBC parameters were
recorded from the first CBC documented in their medical charts.
We used the following cell counter–based formulas in our study:
F1, Shine and Lal Index: MCV × MCV × MCH/100;
F2, Mentzler Index: MCV/RBC count;
F3, Srivastava Index: MCH/RBC count;
F4, Ehsani formula: (MCV - 10×RBC)
F5, Sirdah formula: (MCV- RBC - 3 ×Hb)
F6, Our formula: │80-MCV│×│27-MCH│
The
red blood cell (RBC) count, MCH, hemoglobin (Hb) and MCV were applied
to each formula. Normality of data was checked using SPSS software
version 15.0. If the data had a normal distribution, parametric
analyses (student t-test) were done. Sensitivity and specificity,
positive predictive value (PPV), negative predictive value (NPV) and
accuracy were calculated for each index and formula. Receiver operating
characteristic (ROC) curves were plotted for each index and formula to
check discriminative efficacy, derive new cutoffs, and select the best
indices and formulas for β-thalassemia detection. Statistically
significant differences were defined as comparisons resulting in
p<0.05.
Results
Data of 504 partners (252 men and 252 women) were collected. Among
them 353 (70%) individuals were put into non-BTMi group (278 had
defects in α genes and 75 had no gene defects in the molecular study)
and 151(30%) were identified as being defective in the HBB gene. None
were previously diagnosed as thalassemia carriers. In our study, 44/504
(8.7%, 28 males, 16 females) cases had MCV >80 fl (range 80-91) and
MCH<27 pg. Of these 44, only three of them were diagnosed as BTMi
carriers. On the other hand, none of the 23/504 (4.5%, 14 males, 9
females) individuals with MCH>27 pg (range 27-29.8) and MCV<80 fl
had BTMi.
Means of all RBC parameters, except RBC counts, were higher in non-BTMi group compared to the BTMi group. Table 1
summarizes the mean ± standard deviation of the various hematological
parameters obtained from individuals with microcytic and/or hypochromic
anemia. Also, the results of applying the six different prediction
formulas are shown. The Student t test showed significant differences
in all above RBC parameters and HbA2 levels (P < 0.05). However, no
significant difference in the levels of HbA and HbF of individuals with
or without β thalassemia was observed. Furthermore, all of these six
formulas can differentiate BTMi from non-BTMi with different
accuracies. Some of these data did not have normal distribution;
therefore, non-parametric analyses were performed to confirm the
parametric analysis results (p<0.001) (Table 1).ROC curves were plotted (Figure 1) to obtain new cut-off points with higher sensitivity and specificity for every formula and parameter, as depicted in Table 2.
The optimal cut-off point was obtained according to area under the
curve (AUC) and maximum of sensitivity + specificity. The indicted
criterion value is the cut-off value corresponding to the highest
accuracy (max [sensitivity + specificity]). As indicated in Table 2,
none of the indices studied demonstrated 100% precision in the
recognition of BTMi. However, the Shine–Lal and Sirdah formulas
demonstrated the highest (87.6%) and lowest (66%) sensitivity,
respectively. The highest and lowest specificities were derived from
our formula (87.9%) and Ehsani formula (70%), respectively. We found
the largest AUC in our formula (0.943) which is obviously greater than
other formulas. The second largest is the AUC of Shine-Lal formula
which is 0.940. The smallest AUC belongs to Sirdah formula (0.720).
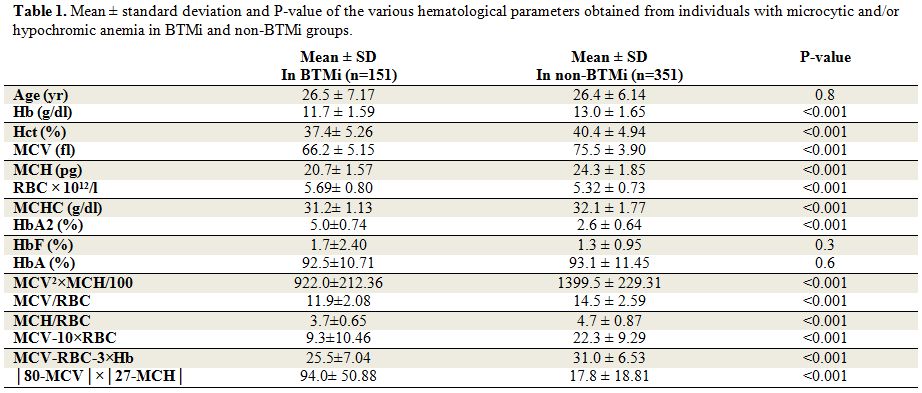 |
Table 1. Mean ± standard deviation and P-value of the various hematological parameters obtained from individuals with microcytic and/or hypochromic anemia in BTMi and non-BTMi groups. |
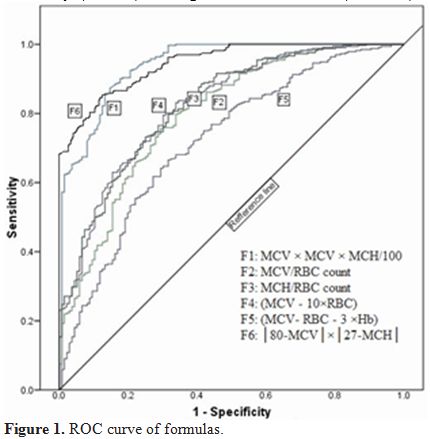 |
Figure 1. ROC curve of formulas. |
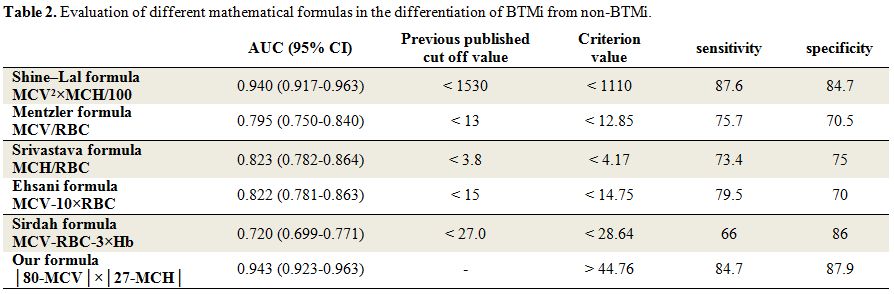 |
Table 2. Evaluation of different mathematical formulas in the differentiation of BTMi from non-BTMi. |
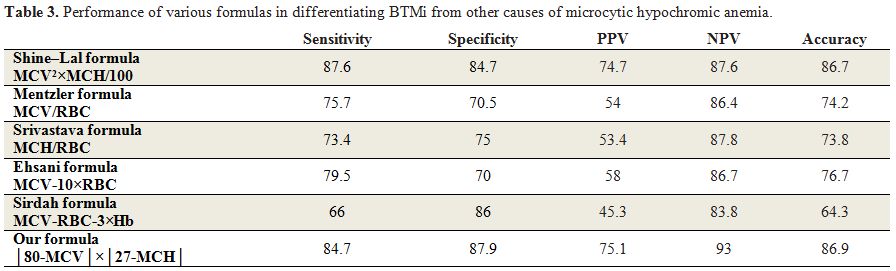 |
Table 3. Performance of various formulas in differentiating BTMi from other causes of microcytic hypochromic anemia. |
Discussion
Six formulas were applied to each case. The two best formulas were
that of Shine and Lal and our formula, which demonstrated 87.6% and
84.7% sensitivity, and 84.7% and 87.9% specificity, respectively. Our
formula with discrimination of 44.76 showed to be a reliable formula to
differentiate BTMi from non BTMi causes of microcytic and hypochromic
anemia. While comparing these two formulas to others, the accuracy is
highly plausible. It is completely congruent with previous studies in
which the Shine and Lal formula was identified as the best method to
detect BTMi.[2,16-18] The cause of
these differences is fundamental to the formula. The data show that
BTMi individuals had lower MCV and MCH compared to patients with other
causes of microcytic hypochromic anemia.[19]
Therefore, by multiplying MCV by MCH, the differences become much more
obvious. Only these two formulas have this characteristic. As is seen
in Table 1, although all RBC
parameters can differentiate BTMi from non-BTMi, if a new formula needs
to differentiate BTMi from other causes of microcytic hypochromic
anemia, several parameters should be multiplied by each other to
increase the strength of differentiation. Also these formulas,
including multiple factors, may be less erroneous than MCV or MCH
measurements alone.[2] Our result showed that MCH is
slightly more accurate than MCV in discriminating individuals with
BTMi, as suggested by a previous study.[20] However, another study claimed that MCV=80 is a proper parameter for screening.[21]
Previous studies reported different sensitivities and specificities for the formulas we mentioned in this study.[2,13,16] The difference may be due to diverse methodology of the studies. Some previous studies[13]
categorized patients to two groups, one with definite diagnosis of BTMi
and the other with iron deficiency anemia (IDA). This means that they
excluded other causes of microcytic hypochromic anemia such as
α-thalassemia trait, chronic diseases, and rare causes such as lead
poisoning and sideroblastic anemia; but it is clear that the mean MCV
and MCH of individuals with the α-thalassemia trait is higher than that
of those with BTMi,[22] so omitting this group can increase sensitivity and specificity of the formulas.
A
practical formula with high sensitivity and specificity is essential
for physicians to rely on their laboratory results to discriminate
between BTMi and other causes of microcytic hypochromic anemia,
specifically in premarital counseling and screening. Therefore, studies
should include other causes instead of IDA to help physicians do
further workups for their patients.
The Batebi et al.[2]
study was compatible with our study in considering other causes of
microcytic hypochromic anemia rather than IDA. However, they reported
higher sensitivity and specificity for Shine–Lal (83.1%-90.6%) and
Mentzler formulas (86.3%-85.4%). Furthermore, the mean values of
Shine–Lal (BTMi=1359.80, non-BTMi=1988.91) and Mentzler formulas
(BTMi=10.98, non-BTMi=15.03) calculated by this study are different
from our study (Table 1). Pornprasert et al. reported that the accuracy of formulas were varied in different populations.[23]
Hence, It is important for physicians of different populations to
establish their own formulas or evaluate the published formulas to
discriminate BTMi from other causes of microcytic hypochromic anemia.[13]
In
this study the ROC curve is generated to evaluate different indices and
formulas. The formula will be more accurate and reliable when the area
under the ROC curve is greater. The AUC of 1.0 represents the best
differentiation while AUC of 0.5 represents the least valuable one.[13]
Collectively, the AUC of all previous formulas except Shine-Lal formula
were smaller than the AUC value reported by Sirdah et al. This is also
true about sensitivity and specificity. The optimal cut-off point
(criterion value) we obtained according to AUC is compatible with
previous published cut-off values for all formulas except for the
Shine-Lal formula. However, approximately all cut off values we
observed are the same as that of Sirdah et al. study.
The distribution of HBB gene mutation is not random all over the world and in each population it has a specific distribution.[24]
The inter-population differences in effects of various RBC indices and
mathematical formulas in discrimination of BTMi and non-BTMi can be
attributed to variable mutation spectrums of the thalassemia disease in
different populations.
The MCV level of individuals with BTMi are associated with the severity of anemia; it represents that different mutations in HBB gene correlate with different MCV levels.[13,25]
Moreover, previous studies showed that hematological phenotypes are
associated with the type of mutation in individuals with BTMi which
could explain the inter-population differences.[13,26]
All
mean values of RBC parameters (MCV, MCH, MCHC, Hct, Hb) we analyzed
were lower in the BTMi group compared to the non-BTMi group except for
RBC count, in agreement with the results of Batebi et al. The result
will be completely different when the comparison is done between BTMi
and IDA as reported by Sirdah et al. We found that HbA2 (α2δ2)
level can significantly differentiate BTMi from non-BTMi; however, no
significant differences are found in the levels of HbA (α2β2) and HbF (α2γ2)
in sera from these two groups. If the mutation occurs in one β gene
(BTMi), the production of β chain will decrease in the serum but δ and
γ chain production will increase to compensate β chain insufficiency.
Therefore, HbA2 and HbF levels will increase but HbA level will
decrease. If a mutation occurs in one or more α genes, production of α
chain will decrease and all HbA, HbA2 and HbF serum levels will
decrease but a percentage of them remain normal. Hence, we expect to
find significant differences in these types of Hb between BTMi and
non-BTMi individuals.
Conclusion
Conclusively, the performance of this new index is slightly better than that was obtained by Shine and Lal formula. It was portrayed in our observation that none of the differentiation indices or formulas provided 100% sensitivity or specificity for discriminating purposes. The cut-off points may be varied in different populations due to variable gene mutations or prevalence of other causes of anemia such as iron deficiency, folate or B12 deficiency that can change RBC parameters.
Acknowledgements
We thank the physicians and personnel of Roodbar Health and Treatment Center for their cooperation, and Mrs. Motahhare Sharifi for her help in all steps of the study.References
 .
.[TOP]