Stergios
Intzes, Marianthi
Symeonidou, Konstantinos Zagoridis, Zoe Bezirgianidou, Georgios
Vrachiolias, Athina Spanoudaki and Emmanouil Spanoudakis.
Democritus
University of Thrace, Medical School, Department of Hematology.
Alexandroupolis, Greece.
Correspondence to: Emmanouil Spanoudakis, Assistant Professor
of
Hematology. Democritus University of Thrace, Medical School.
Alexandroupolis, Greece, Area of Dragana, PC 68100. E-mail:
espanoud@med.duth.gr
Published: January 1, 2021
Received: August 17, 2020
Accepted: December 7, 2020
Mediterr J Hematol Infect Dis 2021, 13(1): e2021006 DOI
10.4084/MJHID.2021.006
This is an Open Access article distributed
under the terms of the Creative Commons Attribution License
(https://creativecommons.org/licenses/by-nc/4.0),
which permits unrestricted use, distribution, and reproduction in any
medium, provided the original work is properly cited.
|
|
Abstract
Background:
Socioeconomic status (SES) is reflecting differences in
sociodemographic factors affecting cancer survivorship. Deprived, low
SES populations have a higher prevalence of multiple myeloma and worst
survival, a condition which widens over time.
Methods:
We performed a meta-analysis of 16 studies (registries and cohorts)
reporting myeloma patients' survival data according to SES. Ten studies
reported Hazzard Ratio (H.R.) (95 % CI), and 16 studies reported p
values. We combined the H.R. from 10 studies, and by using the
Mosteller-Bush formula, we performed a synthesis of p values according
to the area of the globe.
Results:
Combination of H.R. from 10 studies including 85198 myeloma patients
weighted to sample size of each study and adopting the hypothesis of
random effect returned a combined H.R.: 1,26 (1,13-1,31) in favor of
high SES patients.
USA: Synthesis of p values coming from 6
studies (n=89807 pts) by using the Mosteller and Bush formula extracted
a p-value of <0.0001 favoring high SES patients.
Oceania:
Synthesis of p values in two cohorts from Australia and New Zealand (n=
10196 pts) returned a p-value of 0,022 favoring high SES patients.
Europe:
The synthesis of p values from the U.K. and Greece studies (n=18533
pts) returned a p-value of <0,0001 favoring high SES patients.
Asia: Synthesis of 2 studies from Asia (n=915 pts) returned a p-value
of <0,0001 favoring high SES patients.
Conclusions:
Across the globe and widening over decades, the socioeconomic status
remains a gap for equality in myeloma care.
|
Introduction
Overall
Survival (O.S.) of multiple myeloma (MM) patients has improved over the
last decades, with 50% of patients surviving beyond five years after
diagnosis.[1] Autologous
transplantation (ASCT) is still the most
effective anti-myeloma therapy.[2]
However, the introduction of
proteasome inhibitors (bortezomib, carfilzomib, ixazomib), new IMiDs
(lenalidomide, pomalidomide), and anti-CD38 and anti-SLAM monoclonal
antibodies improved survival for both newly diagnosed myeloma (NDMM)
and refractory/relapsed myeloma (RRMM) patients.[3]
Despite
all
this progress, disparities in myeloma care are globally noted, with not
all myeloma patients finally achieving the expected survival benefit. A
primary reason for inequalities in myeloma care is differences in
social resources. The socioeconomic status (SES) is an index calculated
based on education, social support, and income but, actually, is a
surrogate marker reflecting differences in factors like ethnicity or
race, availability of new treatment options, access to health system
facilities, disparities in insurance status/ refurbishment of
anti-myeloma drugs, occupation and place of living (rural or urban vs.
metropolitan).[4] Racial or ethnic
differences in myeloma reflect
differences in factors that interfere with the SES status and disease
biology during all stages of myeloma evolution (from monoclonal
gammopathy to symptomatic myeloma).[5]
Ethnicity/Racial Disparities in
Myeloma Care
The
incidence of myeloma in California is higher for African-Americans
(A.A.) ancestry compared to other races, and most patients are affected
in earlier decades of their lives. Interestingly, A.A. with the highest
SES has 50% more likelihood of being diagnosed with MM.[6]
Although A.A. has a higher incidence of MGUS transformation rates to
symptomatic myeloma is the same across all ethnic subgroups with lower
progression rates for patients from Japan and Mexico.[5]
Disease
characteristics like myeloma-related events or high-risk features are
different across racial/ethnic subgroups. African American patients are
thought to have a lower incidence of specific high-risk cytogenetics
abnormalities (deletion of 17p) but higher rates of t(11;14) and 1q
amp.[7] A mutational study recently
showed that A.A.
myeloma patients had a lower prevalence of the high risk p53 mutation,
while across all ethnic groups, NRAS and KRAS are the most frequently
occurred mutations.[8] Furthermore,
the incidence of
myeloma-related end-organ damage (e.g., need for kidney dialysis),
factors that can delay therapy or put limitations in drug choice, has
been reported with varying incidence according to racial/ethnic
subgroups, affecting thus disease outcome and prognosis.[9]
A.A.
patients with MM, examined on the treatment offered, were less likely
to undergo ASCT and be treated with bortezomib, leading to a potential
association with the worst prognosis.[10]
The
age-adjusted odds of receiving ASCT for MM were significantly higher
for white than for A.A. patients (odds ratio, 1.75; 95% CI, 1.64–1.86;
p=0,01)[11,12] although a recent
study from a single
center in Minnesota reported that SES was in less than 2% of cases a
barrier in order patients to be referred for ASCT.[13]
Another single-center study reported that A.A. patients have a time
since referral to ASCT longer than Whites.[14]
Data from SEER-Medicare data from 2003-2017 shows that ASCT use rates
during first-year increases for A.As.[15]
Notably, African American patients compared to white Americans after
receiving autologous transplant have no difference in disease outcome
(PFS or O.S.), meaning that ASCT can overcome biological differences
among racial subgroups or that equality of treatment overcomes all
racial disparities.[16,17,18] A
recent study by
Munshi et al. conducted on army veterans showed that O.S. disparities
across different races are lost and possibly reversed when all patients
have the same insurance and access to health system providers.[19]
Similarly,
access to new agents is not equal across ethnic/racial subgroups in
health systems where these agents are approved. During the first year
after MM diagnosis, White and African American patients had higher
bortezomib-only usage, but A.A. had lower lenalidomide usage, whereas
Hispanic and Asian patients had higher immunomodulatory drug-only
utilization.[10] Furthermore, a
substantial increase
was seen over the years for both lenalidomide and bortezomib use for
all subgroups except Hispanic patients, and a notable increase in
bortezomib use was noted for all subgroups except Asian patients.[20]
Notably, even today use of novel agents is more distanced from
diagnosis for patients with A.A. and Hispanic origin (5,2 and 4,6
months, respectively) compared to Whites (2,7 months).[15]
Novel Anti-Myeloma Agents and
Disparities in Myeloma Care According to Race/Ethnicity
Another
reason for disparities in myeloma care is participation in clinical
trials testing novel anti-myeloma agents. Patients with MM of Asian or
Hispanic origin are similarly underrepresented in clinical trials
testing new agents in myeloma care. Apart from this, A.A. cancer
patients participating in 35 SWOG clinical trials showed that
early-stage breast and prostate cancer patients of A.A. origin had a
worse outcome; however, an equal survival was noted for myeloma
patients.[21] Overall, in
myeloma's nine clinical studies till 2011, only 18% of patients were
non-Whites and Hispanics.[22,23]
Survival data from these studies show equal survival among ethnic
groups when receiving treatment on the study protocol. A recent
meta-analysis of patients included five clinical trials of myeloma
shows increasing participation of minorities over decades, but still,
Whites are the racial group most often participated in them.[23]
The VISTA study included white race in more than 99% of participants
and other trials FIRST, MMY3002, etc. Whites are 75-88% of
participants. In this meta-analysis, survival rates, according to race,
showed equal probabilities of survival in patients of Asian Pacific
ancestry compared to Whites if they received the new anti-myeloma
drugs.[24] Dilemmas about
different effectiveness of
novel anti-myeloma agents, especially monoclonal antibodies, in disease
control due to immunological haplotypes were not proved evidence-based
since, in a small series of 82 patients treated with either elotuzumab
or daratumumab response rates, duration of response and adverse events
were similar across ethnic groups.[25]
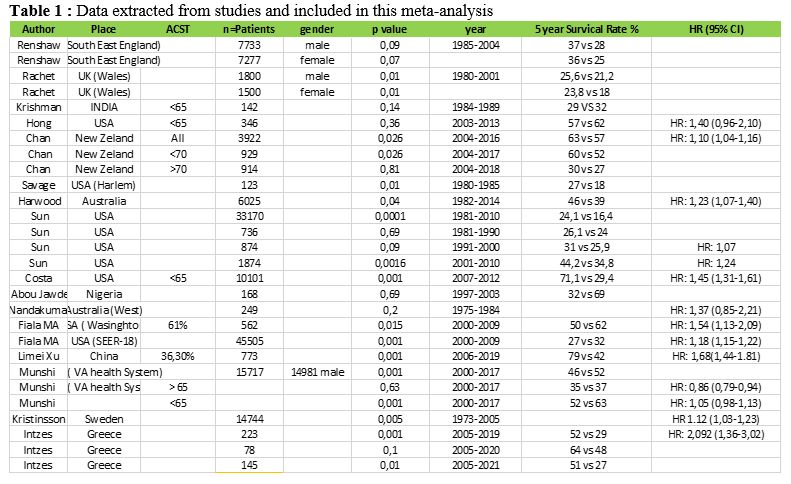 |
Table
1. Data extracted from studies and included in this meta-analysis.
|
Single-center Experience on Myeloma
Care in the Muslim Minority of Thrace, Greece
In
our single-center cohort of 223 MM patients from East Macedonia and
Thrace in Greece, 172 patients were of Greek origin, 39 were of Greek
Muslims, and 12 of Balkan origin. The end-organ damage (end-stage renal
failure, severe bone disease) were not different across racial
subgroups (Figure 1A).
The
presence of Extra Medullary Disease (EMD) prevailed in a higher
percentage in Greek Muslims, but other high risk features like ISS
stage III and high risk cytogenetics were equally distributed among
racial subgroups. Autologous SCT was offered in the same percentage of
transplant-eligible patients (48% vs. 46%, p=0,873), and the exposure
to both lenalidomide and bortezomib (at least two complete cycles from
each agent) was administered at the same percentage of patients (Figure 1A).
Survival data shows equal median O.S. across racial subgroups, but
myeloma patients of Greek Muslim origin had longer PFS after first-line
anti-myeloma therapy, but no statistical significance was reached (Log
Rank p=0,1, Figure 1B).[26]
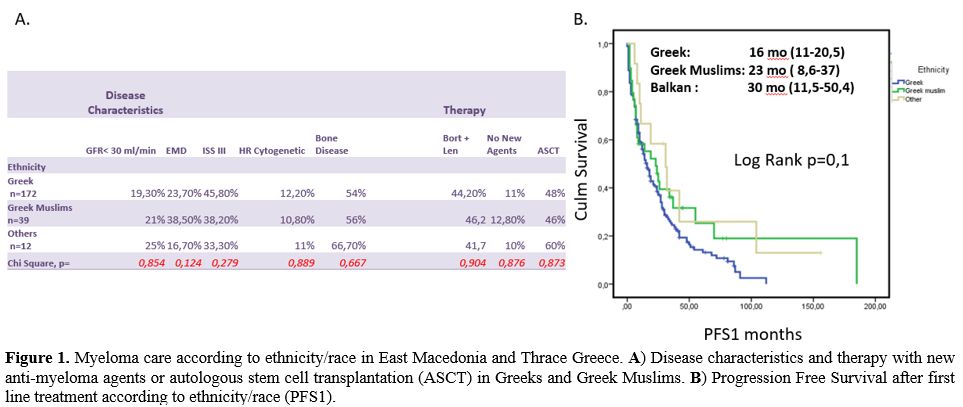 |
Figure
1. Myeloma care according to ethnicity/race in East Macedonia and
Thrace Greece. A) Disease
characteristics and therapy with new anti-myeloma agents or autologous
stem cell transplantation (ASCT) in Greeks and Greek Muslims. B) Progression Free
Survival after first line treatment according to ethnicity/race (PFS1).
|
Access to Medical Centers and Availability
of Best Anti-Myeloma Care
Overall,
cancer patients in the USA do not have the same probabilities of
receiving care and therapy for their disease in NCI institutes, so the
different outcomes in all cancers. Access to National Cancer Institute
(NCI) and National Comprehensive Cancer Network (NCCN) increased
myeloma-related survival after 1996 in places with more than 2 NCI
centers or more than 1 NCCN center and only for White patients.
Accordingly, for ASCT, the best available anti-myeloma therapy with
decreasing mortality rates through decades, disparities exist according
to patients' insurance status and hospitals' volume where ASCT took
place.[27] Low volume hospitals
(<10 ASCT per
year) had a crude mortality rate of 3,86% compared to 0,80% for high
volume hospitals, and public hospitals had a crude mortality rate of
2,86% vs. 0,78% hospitals caring for patients with other insurance
coverage. Facility volume is generally related to myeloma survival.
National Cancer database includes 94.777 MM patients and 1333 medical
centers, after multivariable analysis, showed that facility volume was
independently associated with all-cause mortality for private
hospitals. The unadjusted median overall survival by facility volume
was 26.9 months for low volume facilities vs. 49.1 months for high
volume facilities.[28]
Outside the USA in 15
Latin American countries, the FISH analysis was available in 67% of
patients, MRI in 44%, and PET/CT was offered in 66,7% of patients.
Treatment availability queries showed that ASCT was available in 11/13
countries, bortezomib, and lenalidomide in more than 90% of reported
physicians, and pomalidomide, carfilzomib, and daratumumab is
accessible in around 60% of physicians participating in this study.
Maintenance therapy was prescribed in almost all indicated patients.
However, there were significant differences in access to tests and
treatments for multiple myeloma between public and private systems.
Although patients can be referred to the private or public center for
anti-myeloma care, that does not significantly impact patients'
survival when the same protocols were utilized. All physicians reported
having access to thalidomide and bortezomib. Autologous stem cell
transplant (ASCT) is available in most countries (11/13). Lenalidomide
is commercially available in 97.9% (96), melphalan in 92.7% (94),
daratumumab in 68% (65), pomalidomide in 67% (57), carfilzomib in 60%
(57), and ixazomib in 18%. Nevertheless, the commercial availability of
these drugs does not mean patients have access to them, as
reimbursement issues and local health policies often do not provide
them due to their high cost.[29]
Socioeconomic Status and Cancer
Survivorship
SES
has been linked with survival in a variety of cancers. Afshar et al.,
in a study from Australia reporting survival data in all cancer
patients diagnosed between 2001-2015, found that patients from the most
deprived for social sources areas had worst cancer survivorship with
patients with lung, colorectal, breast, prostate cancer, and melanoma
to have the higher survival gap according to SES.[30]
A recent analysis of SEER registry data, including 327078 cancer
patients from the USA, showed increased mortality for low SES patients
than high SES patients across all races and ethnicities. In high SES
patients, Whites had better survival compared to other high SES
patients from other races; a difference widened in patients suffering
from breast colorectal or prostate cancer.[31]
Socioeconomic Status and
Hematological Malignancies
Deprived
socioeconomic status has been linked with poor survival and a wide
variety of myeloid[32] and
lymphoid[33,34]
hematological malignancies. Children and young adolescents with acute
myeloid (AML) and lymphoid leukemia (ALL) enjoy improvement over
decades of survival. Racial disparities are not that sharp now a days,
especially for ALL patients, and allogeneic transplants are equally
offered across all races, but there is still a gap in donor
availability in patients of A.A. origin.[35]
In
Diffuse Large B-cell lymphoma (DLBCL) patients, conflicting data about
SES's effect on survival exists. In the USA, DLBCL patients with
no-insurance or Medicaid insurance had inferior survival compared to
non-Medicaid insurance.[36]
Studies show that
patients from urban/rural areas compared to metropolitan areas had the
worst survival due to a multifactorial etiology.[37]
Delay in diagnosis, low SES, deprivation of financial resources, and,
most importantly, fewer probabilities of receiving care in a high
volume experienced in the lymphoma medical center are the main reasons
for low SES patients' worst outcome. A recent study from the USA shows
that low SES patients do not receive chemo-immunotherapy at the same
rate, and when therapy is equal, survival rates are not affected by
SES, at least for older patients above the age of 65. Hodgkin disease
survival in young adults is not different across racial barriers, but
Hodgkin disease incidence is strongly related to living in high SES
affluent areas.[38] In Follicular
lymphoma, a disease
with a chronic course with remissions and relapses, similarly to MM,
patients below 65 with the USA's worst insurance had a hazard ratio for
death 1,96 (H.R 1.96; 95% CI, 1.69-2.28).[39]
SES is related to diminish survival rate in mantle cell lymphoma
patients as well.[34]
Considering
the impact of SES on myeloma survival, many data exist in the
literature that supports SES as a prognostic survival factor globally
and across all decades.[40,41,42]
Some studies are relating to SES and the incidence of myeloma.
Socioeconomic Status and Incidence of
Multiple Myeloma
Incidence
of myeloma is highly variable among countries but is globally rising
through the decades, reaching 2,1 cases per 100.000 habitants per year.[43] The highest prevalence of myeloma
is met in Australia, North America, and Western Europe.[43]
Available data about the incidence of MM and SES are conflicting. In
population-based studies, MM and its preceded MGUS have been positively
related to high SES because of earlier diagnosis.[44]
Other studies are reporting a higher incidence of MM in low SES mostly
related to occupational hazard[45]
with farmers and industrial workers, especially after prolonged
exposure to pesticides or other industrial chemicals to be in danger.[46,47] Obesity, a strong risk factor
for MGUS development, is often seen in patients with low
sociodemographic characteristics.[48]
A population case-control study included 206 Black and 367 White MM
cases plus 2131 controls found out that low occupation-based SES was
significantly associated with an increased risk of MM.[49]
Socioeconomic Status and Myeloma
Survival
Plenty
of cohort studies reports data on the role of SES on myeloma survival
in the literature. In order to extract and analyze all available data,
we performed a meta-analysis of published studies.
Search Strategy and Statistical
Analysis
We
conducted a PubMed search using the following criteria; (myeloma OR
plasma cell dyscrasia) AND (socioeconomic status OR social index OR
SES), and 288 abstracts were returned. After reading abstracts, we
resulted in 29 studies. Three independent reviewers (ES, SI, MS) red
full-text articles and 16 studies full-filling our inclusion criteria
(reporting five ys survival rate in patients with High or Low SES) were
included in this meta-analysis of cohort studies. After selecting
studies, data were extracted, and we compared five ys O.S. in High SES
and Low SES myeloma patients (Studies Flow Diagram in Figure 2).
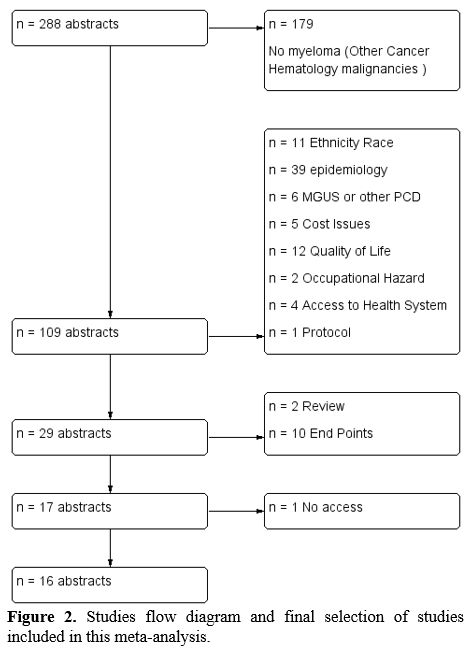 |
Figure
2. Studies flow diagram and final selection of studies included in this
meta-analysis.
|
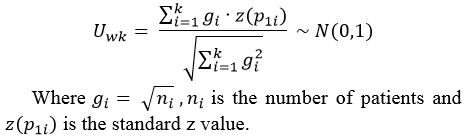
We
separated subgroups according to the geographical area of the study. To
synthesize data from different cohort studies, we used the Mosteller
and Bush formula, which is the generalization of the z-test. This
formula gives weight to each study concerning the number of patients.
Under the null hypothesis, the weighted sum still has a normal
distribution with mean 0 and variance equals the sum of the weights'
square. So we have the formula:
In
some studies (n=10), Hazzard Ratio (H.R.), and 95% confidence interval
for O.S. in High SES and Low SES myeloma patients were reported. By
using the RevMan software, a Cochrane tool, we performed a
meta-analysis of the reported H.R.
Results
Combined from Eleven Studies Hazzard Ratio for Death in High SES and
Low SES Myeloma Patients
A
meta-analysis of 10 studies (two of them Sun et al., Fiala et al. gives
H.R. in two cohorts) that reported H.R. and 95% CI for survival
differences according to SES status of myeloma patients, weighted to
sample size of each study and to adopt the hypothesis of random effect
returned a combined H.R.: 1,26 (1,13-1,31). In this meta-analysis,
85198 myeloma patients were included demonstrating a better survival
probability for high SES patients by 1,26 times compared to low SES
patients (Figure 3A).
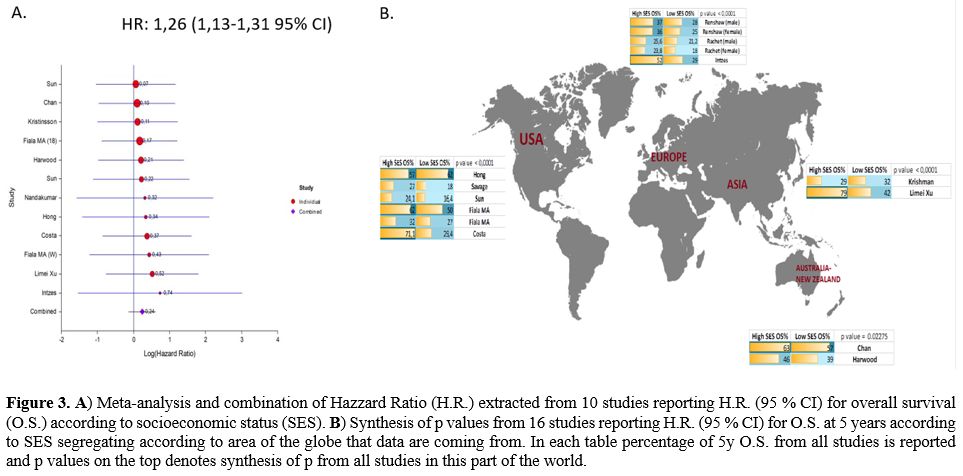 |
Figure
3. A)
Meta-analysis and combination of Hazzard Ratio (H.R.) extracted from 10
studies reporting H.R. (95 % CI) for overall survival (O.S.) according
to socioeconomic status (SES). B)
Synthesis of p values from 16 studies reporting H.R. (95 % CI) for O.S.
at 5 years according to SES segregating according to area of the globe
that data are coming from. In each table percentage of 5y O.S. from all
studies is reported and p values on the top denotes synthesis of p from
all studies in this part of the world.
|
Socioeconomic Status and Disparities
in 5 Years Overall Survival of Myeloma Patients According to Geography
In
this meta-analysis, we conducted a synthesis of p values by using the
Mosteller and Bush formula and included 134363 myeloma patients. We
extracted data from studies, and we reported a 5-year O.S. rate in Low
and High SES patients. Two studies are reporting separately for women
and men (Renshaw and Rachet). We made a synthesis of p values from
studies in four geographic areas of the globe; USA included six studies
(Sun et al., Costa et al., Savage et al., Hong et al., Fiala cohort,
and SEER data), Australia and New Zeeland 3 studies (Chan et al.,
Harwood et al., Nandakumar et al.), Europe 3 studies (Renshaw et al.,
Rachet et al., Intzes eta al), Asia included two studies (Krismann et
al., Limei Xu et al.)
USA: Health System Disparities and
the Impact of SES on Myeloma Survival
In
the United States, there is no single national system of health
insurance. Health insurance is purchased in the private marketplace or
provided by the government to some groups. Private health insurance can
be purchased from commercial insurance companies or non – profit
insurers. About 84% of the population is covered by either public (26%)
or private (70%) health insurance. Approximately 61% of health
insurance coverage is employment-related.
The health care system
in the USA is characterized by broad economic inequalities. The life
expectancy of the wealthiest Americans now exceeds that of the poorest
by 10-15 years. Poor Americans have worse access to health care than do
wealthy Americans because many remain uninsured despite coverage
expansions since 2010 due to the Affordable Care Act (ACA).
Significantly, more than 37 million Americans do not have health
insurance, and 41 million more have inadequate access to care.
According
to SEER registry reporting data from over than 30.000 myeloma patients
diagnosed from 1981 to 2010 in the USA, gap on survival rates according
to SES has widened over time (affluent to deprived: 26,1%, 26,8% and
24,8% in the first decade, 31,2%, 28,1%, and 25,9% in the second decade
and 44,2%, 40,5%, and 34,8% in the third decade). The Kaplan–Meier
survival analyses confirmed the widening survival gaps among SES
groups, with p values of 0,0016 during the last decade when more
effective anti-myeloma treatments became available.[50]
This
decade's focus was made by Costa et al., reporting data from 10,161
cases of MM diagnosed before the age of 65 years from 2007 t0 2012 and
included in the SEER-18 registry. In the Cox proportional hazards
model, only marital status, insurance status, and county-level income
significantly influenced O.S. The cumulative effect of sociodemographic
factors associated with shorter survival in the multivariable analysis
was statistically significant (p<0,0001). The 4 years OS%
reported
71,1%, 63,2% 53,4% and 46,5% for patients with 0, 1, 2, 3 adverse
sociodemographic factors.[51]
Fiala et al.
reported retrospectively from five-hundred-sixty-two patients eligible
for analysis included in medical records from Washington University
School of Medicine.
High-SES patients were less likely to have
comorbidities at diagnosis than middle-SES and low-SES patients (58%
compared to 72% and 76%, p=0.007) and were more likely to have private
insurance at diagnosis. High-SES patients were more likely to undergo
ASCT than middle-SES and low-SES patients (72% compared to 59% and 52%,
respectively, p<0.001). In multivariate analysis of SES, age at
diagnosis, year of diagnosis, race, comorbidity score, ASCT
utilization, and insurance provider, all other variables except
insurance provider, were independently associated with survival.[41]
The
same group tested their patients' results in SEER-18 registry reporting
from patients recorded until November 2012. 45.505 MM patients were
identified for analysis. The median age at diagnosis was 69 years
(range 18–85+), and 18 percent were black. In a multivariate model, SES
was associated with O.S. [HR 1.18 (95% CI 1.15–1.22) for low-SES
relative to high-SES; HR 1.10 (95% CI 1.07–1.13) for middle-SES
relative to high-SES].[41]
Hong et al. reported
data from 354 transplant eligible patients from the USA, and they did
not observe any significant differences in O.S. or Progression-Free
Survival (PFS) and relapse rate based on recipient SES at ASCT in
univariate analyses or multivariable analysis after adjusting for
significant patient-, disease-, and transplantation-related variables.[52]
There
is also a small study from Harlem Hospital reporting from 1980 to 1985
and found out that low socioeconomic index resulted in a significantly
lower five-year O.S. rate (27 vs. 18%; p=0,01).[42]
We
performed the synthesis of p values coming from these six studies
(n=89807 pts) by using the Mosteller and Bush formula, and the
extracted p-value was <0.0001, meaning that in the USA, there is
a
statistically significant association between low SES and O.S. across
all age groups and decades (Figure
3B).
Australia: Health System Disparities
and the Impact of SES on Myeloma Survival
The
Australian health system involves multiple layers of responsibility and
funding provided by governments, individuals, and private health
insurers.
Primary care is mostly provided in the community by
general practitioners (GPs) who are generally self-employed. G.P.s also
operate as 'gatekeepers', referring patients to specialist medical
services where needed. The national public health insurance scheme
«Medicare» provides subsidies for most medical and diagnostic and some
other health services.
Public hospital treatment is free for
people but can be subject to long waiting times for elective surgery.
Private hospitals cater to patients who want a choice of doctor and
private ward accommodation. For private hospitals, Medicare pays 75
percent of the Medicare schedule fee, with the balance met by private
health insurance.
A range of free or low-cost public health
services, including immunization and mental health services, are
provided by community health facilities. Prescription medicines are
dispensed by private community pharmacists paid by the Australian
government (under a Pharmacy Agreement) to dispense medicines
subsidized under the Pharmaceutical Benefits Scheme (PBS).
An
older study from Australia reported data from 249 myeloma patients
diagnosed from 1975 through 1984 and found no difference in O.S.
according to SES p=0,2 in this decade where chemotherapy was the most
effective treatment.[53] Another
study from Australia
reporting survival data from more than 6000 myeloma patients diagnosed
between 1981 to 2014 found that five-year relative survival across all
treatment eras for disadvantaged patients was 39% (95% CI 0,36–0,42)
vs. affluent patients 46% (95% CI 0,42–0,49) (p<0.001). There
was no
significant difference in relative survival for the middle class in
multivariate analysis than affluent SES patients. Importantly,
residence and SES were significant in multivariate testing,
demonstrating that each was independently predictive of O.S.[54]
New Zealand: Health System
Disparities and the Impact of SES on Myeloma Survival
New
Zealand's original indigenous inhabitants are Māori. In 2014, New
Zealand had an estimated population of 4,547,000. (2) The population
mainly has European ethnicity (74 %), and there are significant Māori
(15%), Pacific Island (7%), and Asian (12%) populations (1).
The
health care system is has been funded by the government since the early
1940s, and public funding currently accounts for 83% of total health
expenditure Government-owned hospitals provide accident and emergency,
inpatient, outpatient, and community care free of charge to all New
Zealanders.
Primary
health care services such as general practitioner (G.P.), pharmacy, and
diagnostic services have traditionally been delivered through privately
owned, small independent businesses funded by the government.
A
recent study from the New Zealand Cancer Registry performed in the era
of modern drugs from 2004 to 2016 has reported in multivariate analysis
age [hazard ratio (HR) 1,06, 95% CI 1,05-1,07], socio-economic
deprivation (HR 1,10, 95% CI 1,04- 1,16) and 4 regions of the country
(HR 1,12, 95% CI 1,05 - 1,19) as negative, and treatment with ASCT (HR
0,66, 95% CI 0,51- 0,87) or bortezomib (HR 0,74, 95% CI 0,64 - 0,86) as
positive independent prognostic factors for OS. The most deprived
groups had an inferior 3-year OS compared to others (57 vs. 63%;
p=0,026) and experienced no improvement in survival following the
funding of bortezomib despite similar uptake of first line bortezomib.[55]
Synthesis
of p values from two cohorts from Australia and a New Zealand cohort
(n=10196 pts) returned a p-value of 0,022 indicated SES as a prognostic
factor and in Oceania (Figure
3B).
United Kingdom: Health System
Disparities and the Impact of SES on Myeloma Survival
The
health care system of the United Kingdom has since 1997 been assigned
the responsibility for organizing health financing and services to
relevant public officials. All U.K. citizens have maintained national
health services, which provide universal access to a comprehensive
package of services that are mostly free at the point of use. These
health services are predominantly financed from general taxation, and
83.5% of total health expenditure in the United Kingdom came from
public sources in 2013.
Life
expectancy has increased steadily across the United Kingdom, but health
inequalities have proved resistant to improvement, and the gap between
the most deprived and the most privileged continues to widen rather
than close.
Renshaw
et al. reported data from 10,015 myeloma patients diagnosed from 1985
through 2004 and included in the Thames Cancer Registry. When
considering patients with myeloma diagnosed in the era of targeted
therapies from 2000 to 2004 in both males and females, there was a
tendency for higher survival in patients resident in the most affluent
areas (males trend p= 0,09, females trend p= 0,07).[56]
Rachet
et al., in another U.K. study, reported data from 40.000 myeloma
patients according to the year of diagnosis and relative deprivation of
social supporting factors (social gap). They found out that the equal
myeloma survival for deprived women noted in the late 1980s had wholly
reversed by the late 1990s. These vast differences among deprivation
groups in survival trends, with no improvement at all in 5-year
survival among the most deprived group, but an increase of more than
10% for the most affluent groups expected to be further widened in the
future.[57]
Greece: Health System Disparities and
the Impact of SES on Myeloma Survival
The
Greek national health system provides healthcare benefits/services
through a network of public/state providers and contracted private
primary, hospital, and ambulatory care providers. Private providers'
presence is more obvious in primary care, especially in diagnostic
technologies, private physicians' practices, and pharmaceuticals. The
system is financed by the state budget, social insurance contributions,
and private payments.
The
National Organization for the Provision of Health Services (Greek
acronym EOPYY) negotiates contracts and remunerates health
professionals. At the Pharmacist's, there is usually a co-payment of
25% of medicinal products' cost. Some patients' groups, such as cancer
patients, the chronically ill, and pregnant women, receive medicines
free of charge or pay a reduced co-payment.
In
a recently published study, we retrospectively collected data from 223
myeloma patients treated in our department from January 2005 till
December 2019. Based on the intention to treat (ITT), 78 patients were
considered transplant eligible (T.E.), and 145 were non-transplant
eligible (NTE). In Kaplan Mayer survival analysis, including all MM
patients of our cohort, the Low SES group n=100 had inferior survival
compared to High SES patients n=123 [Median O.S. (95% CI) for Low SES:
28 months (18-37,9) High SES: 68 months (55,6-80,4), Long Rank
p=0,000). The Low SES effect on O.S. is more evident in the
non-transplant eligible (NTE) elderly myeloma patients and those
diagnosed at I stage ISS.[26]
The
synthesis of p values from the U.K. and Greece studies (n=18533 pts)
returned a p-value of <0,0001 suggested that SES remains an
important prognostic factor of survival in Europe (Figure 3B).
Asia and Africa
A
recent study from China by Limei Xu et al. included 773 NDMM patients
diagnosed from 2006 to 2019 found out that low SES patients received
ASCT at a lower rate and had a worst PFS and O.S. Patients with high
education levels had a median overall survival (O.S.) of 122.27 (95%
CI: 117.05–127.49) months, which was also better than that of patients
with low education levels (58.83 months, 95% CI: 48.87–62.79, p<
0.001). Developing countries contributed two small studies to our
analysis. A small cohort from India reporting data from 132 myeloma
patients diagnosed during the 80s found similar survival rates for low
and middle SES.[58] Similarly,
another study from
Nigeria reports data from 292 newly diagnosed and relapsed myeloma
patients and found no difference in O.S. according to SES p=0,69 in
multivariate analysis.[59]
Synthesis of 2
studies from Asia (n=915 pts) returned a p-value of< 0,0001
showing
a better survival for high SES myeloma patients compared to low SES and
in this part of the world (Figure
3B).
Financial Toxicity of Myeloma
Treatment
Myeloma
is a disease model for drug development that led to 11 new medications'
approval since 1998. Although new treatment allows better disease
control, they also stress payers' budgets. In 2000, the total all-cause
health care cost of myeloma was $3,263 per patient per month (PPPM)
($346 PPPM or 10.6% for myeloma treatment-related drug costs) and
increased to $14,656 PPPM in 2014 ($4,176 PPPM or 28.5% for myeloma
treatment-related drug costs).[60]
Furthermore,
real-world data shows that myeloma patients' treatments are not always
given in optimal ways. MacEwan et al. showed that the average duration
of treatment by a line of therapy was seven months for the first line,
six months for the second line, and five months for the third line.[61] So payments in the real world
setting cannot bring the maximum benefit for myeloma patients.
After
patients are diagnosed with cancer, the purchase of therapies affects
their personal economics (pocket cost) by two ways; first, contributing
to calculations of the cost of insurance premiums and second through
cost-sharing mechanisms imposed by insurers.[1]
Furthermore, employment issues due to myeloma are arising. In a
recently published study, five hundred (66%) of the respondents
reported that they were employed at the time of diagnosis and treatment
onset. However, by the time they completed the study questionnaire,
only 33% were employed.[62] In the
same study, 29% of
participants changed or lost coverage after myeloma diagnosis,
including 10% unable to obtain replacement insurance and 35% applied
for disability support programs.[62]
Considering the
ability to work, this is affected by the choice of an anti-myeloma
treatment plan. Merola et al. reported that patients who received
injectable therapy missed an average of 110 workdays in the one year
after diagnosis, compared with 87 for patients receiving only oral
therapy.[63]
Myeloma
care's financial toxicity is increasing for both health system payers
and for patients' as well. Disparities in myeloma care will widen since
the most deprived will fail to meet the need for continuous
administration of expensive therapies.
Conclusions
SES
is an established poor prognostic factor for survival in many cancers.
Differences in SES are a surrogate marker reflecting other factors like
ethnicity/race, insurance cover, place of living, accessibility to
health services etc. In this meta-analysis, we performed the synthesis
of p values from 16 studies that included 134363 MM patients diagnosed
from 1975 to 2019 and weighted according to the number of patients
included in each study. We demonstrated that SES remains a significant
prognostic factor for O.S. in myeloma patients globally (p-value of
<0,0001). Synthesis of H.R. from 10 studies shows that high SES
myeloma patients have 1,26 (95% CI 1,13-1,31) more probabilities to be
alive at five years compared to low SES patients. Financial
intoxication of myeloma care on health systems and patients is rising
through the decades. Therefore the gap in myeloma care between deprived
and affluent patients is expected to widen in the future.
Acknowledgments
S.Intzes,
M. Symeonidou, and K. Zagoridis reviewed papers and perform statistical
analysis. G Vrachiolias, Z. Bezirgiannidou, and A. Spanoudaki search
literature, export data, and create figures; E. Spanoudakis supervised
research, reviewed papers, and wrote the paper with contributions from
all co-authors.
This
work was supported by an unrestricted educational grant from the
pharmaceutical company FARAN Hellas.
References
- Fonseca R, Hinkel J.
Value and Cost of Myeloma Therapy-We Can Afford It. Am Soc Clin Oncol
Educ Book 2018; 38: 647-655. https://doi.org/10.1200/EDBK_200869
PMid:30231366
- Kumar
L, Cyriac SL, Tejomurtula TV et al. Autologous stem cell
transplantation for multiple myeloma: identification of prognostic
factors. Clin Lymphoma Myeloma Leuk 2013; 13: 32-41. https://doi.org/10.1016/j.clml.2012.08.007
PMid:23085487
- Moreau
P, San Miguel J, Sonneveld P et al. Multiple myeloma: ESMO Clinical
Practice Guidelines for diagnosis, treatment and follow-up. Ann Oncol
2017; 28: iv52-iv61. https://doi.org/10.1093/annonc/mdx096
PMid:28453614
- Ailawadhi
S, Bhatia K, Aulakh S et al. Equal Treatment and Outcomes for Everyone
with Multiple Myeloma: Are We There Yet? Curr Hematol Malig Rep 2017;
12: 309-316. https://doi.org/10.1007/s11899-017-0393-y
PMid:28626849
- Greenberg
AJ, Vachon CM, Rajkumar SV. Disparities in the prevalence, pathogenesis
and progression of monoclonal gammopathy of undetermined significance
and multiple myeloma between blacks and whites. Leukemia 2012; 26:
609-614. https://doi.org/10.1038/leu.2011.368
PMid:22193966 PMCid:PMC3629947
- Rosenberg
AS, Brunson A, Jonas BA et al. Association Between Autologous Stem Cell
Transplant and Survival Among Californians With Multiple Myeloma. J
Natl Cancer Inst 2019; 111: 78-85. https://doi.org/10.1093/jnci/djy073
PMid:29897481 PMCid:PMC6335109
- Greenberg
AJ, Philip S, Paner A et a. Racial differences in primary cytogenetic
abnormalities in multiple myeloma: a multi-center study. Blood Cancer J
2015; 5: e271. https://doi.org/10.1038/bcj.2014.91
PMid:25555162 PMCid:PMC5404218
- Kazandjian
D, Hill E, Hultcrantz M et al. Molecular underpinnings of clinical
disparity patterns in African American vs. Caucasian American multiple
myeloma patients. Blood Cancer J 2019; 9: 15. https://doi.org/10.1038/s41408-019-0177-9
PMid:30718460 PMCid:PMC6361959
- Marinac CR, Ghobrial IM,
Birmann BM et al. Dissecting racial disparities in multiple myeloma.
Blood Cancer J 2020; 10: 19. https://doi.org/10.1038/s41408-020-0284-7
PMid:32066732 PMCid:PMC7026439
- Ailawadhi
S, Frank RD, Advani P et al. Racial disparity in utilization of
therapeutic modalities among multiple myeloma patients: a SEER-medicare
analysis. Cancer Med 2017; 6: 2876-2885. https://doi.org/10.1002/cam4.1246
PMid:29105343 PMCid:PMC5727310
- Costa
LJ, Huang JX, Hari PN. Disparities in utilization of autologous
hematopoietic cell transplantation for treatment of multiple myeloma.
Biol Blood Marrow Transplant 2015; 21: 701-706. https://doi.org/10.1016/j.bbmt.2014.12.024
PMid:25555447 PMCid:PMC4361014
- Fiala
MA, Finney JD, Stockerl-Goldstein KE et al. Re: Disparities in
Utilization of Autologous Hematopoietic Cell Transplantation for
Treatment of Multiple Myeloma. Biol Blood Marrow Transplant 2015; 21:
1153-1154. https://doi.org/10.1016/j.bbmt.2015.03.005
PMid:25771403
- Yun
HD, Dossul T, Bernal-Mizrachi L et al. Referral Patterns and Clinical
Outcomes for Transplant-Eligible Lymphoma and Myeloma Patients
Evaluated at an Urban County Hospital. J Stem Cell Res Ther 2016; 6.
- Bhatnagar
V, Wu Y, Goloubeva OG et al. Disparities in black and white patients
with multiple myeloma referred for autologous hematopoietic
transplantation: a single center study. Cancer 2015; 121: 1064-1070.
https://doi.org/10.1002/cncr.29160 PMid:25469920
- Ailawadhi
S, Parikh K, Abouzaid S et al. Racial disparities in treatment patterns
and outcomes among patients with multiple myeloma: a SEER-Medicare
analysis. Blood Adv 2019; 3: 2986-2994. https://doi.org/10.1182/bloodadvances.2019000308
PMid:31648322 PMCid:PMC6849958
- Derman
BA, Jasielec J, Langerman SS et al. Racial differences in treatment and
outcomes in multiple myeloma: a multiple myeloma research foundation
analysis. Blood Cancer J 2020; 10: 80. https://doi.org/10.1038/s41408-020-00347-6
PMid:32770051 PMCid:PMC7414120
- Verma
PS, Howard RS, Weiss BM. The impact of race on outcomes of autologous
transplantation in patients with multiple myeloma. Am J Hematol 2008;
83: 355-358. https://doi.org/10.1002/ajh.21139
PMid:18186525
- Schriber
JR, Hari PN, Ahn K.W. et al. Hispanics have the lowest stem cell
transplant utilization rate for autologous hematopoietic cell
transplantation for multiple myeloma in the United States: A CIBMTR
report. Cancer 2017; 123: 3141-3149. https://doi.org/10.1002/cncr.30747
PMid:28472539 PMCid:PMC5544566
- Fillmore
NR, Yellapragada SV, Ifeorah C et al. With equal access, African
American patients have superior survival compared to white patients
with multiple myeloma: a V.A. study. Blood 2019; 133: 2615-2618. https://doi.org/10.1182/blood.2019000406
PMid:31003998 PMCid:PMC6566591
- Ailawadhi
S, Frank RD, Sharma M et al. Trends in multiple myeloma presentation,
management, cost of care, and outcomes in the Medicare population: A
comprehensive look at racial disparities. Cancer 2018; 124: 1710-1721. https://doi.org/10.1002/cncr.31237
PMid:29360160
- Albain
KS, Unger JM, Crowley JJ et al. Racial disparities in cancer survival
among randomized clinical trials patients of the Southwest Oncology
Group. J Natl Cancer Inst 2009; 101: 984-992. https://doi.org/10.1093/jnci/djp175
PMid:19584328 PMCid:PMC2724852
- Duma
N, Azam T, Riaz IB et al. Representation of Minorities and Elderly
Patients in Multiple Myeloma Clinical Trials. Oncologist 2018; 23:
1076-1078. https://doi.org/10.1634/theoncologist.2017-0592
PMid:29700207 PMCid:PMC6192659
- Ailawadhi
S, Jacobus S, Sexton R et al. Disease and outcome disparities in
multiple myeloma: exploring the role of race/ethnicity in the
Cooperative Group clinical trials. Blood Cancer J 2018; 8: 67. https://doi.org/10.1038/s41408-018-0102-7
PMid:29980678 PMCid:PMC6035273
- Pulte
ED, Nie L, Gormley N et al. Survival of ethnic and racial minority
patients with multiple myeloma treated with newer medications. Blood
Adv 2018; 2: 116-119. https://doi.org/10.1182/bloodadvances.2017010512
PMid:29365319 PMCid:PMC5786427
- Chehab
S, Zhang C, Panjic EH et al. Response to therapeutic monoclonal
antibodies for multiple myeloma in African Americans versus whites.
Cancer 2018; 124: 4358-4365. https://doi.org/10.1002/cncr.31746
PMid:30303526
- Intzes
S, Symeonidou M, Zagoridis K et al. Socioeconomic Status Is an
Independent Prognostic Factor for Overall Survival in Patients With
Multiple Myeloma: Real-World Data From a Cohort of 223 Patients. Clin
Lymphoma Myeloma Leuk 2020; 20: 704-711. https://doi.org/10.1016/j.clml.2020.05.013
PMid:32653455
- Ailawadhi
S, Advani P, Yang D et al. Impact of access to NCI- and NCCN-designated
cancer centers on outcomes for multiple myeloma patients: A SEER
registry analysis. Cancer 2016; 122: 618-625. https://doi.org/10.1002/cncr.29771
PMid:26565660
- Go
RS, Bartley AC, Crowson CS et al. Association Between Treatment
Facility Volume and Mortality of Patients With Multiple Myeloma. J Clin
Oncol 2017; 35: 598-604. https://doi.org/10.1200/JCO.2016.68.3805
PMid:28199819
- Riva
E, Schutz N, Pena C et al. Significant differences in access to tests
and treatments for multiple myeloma between public and private systems
in Latin America. Results of a Latin American survey. GELAMM (Grupo de
Estudio Latino Americano de Mieloma Multiple). Ann Hematol 2020; 99:
1025-1030. https://doi.org/10.1007/s00277-020-03983-x
PMid:32157420
- Afshar
N, English DR, Blakely T et al. Differences in cancer survival by
area-level socioeconomic disadvantage: A population-based study using
cancer registry data. PLoS One 2020; 15: e0228551. https://doi.org/10.1371/journal.pone.0228551
PMid:31999795 PMCid:PMC6992207
- Kish
JK, Yu M, Percy-Laurry A, Altekruse SF. Racial and ethnic disparities
in cancer survival by neighborhood socioeconomic status in
Surveillance, Epidemiology, and End Results (SEER) Registries. J Natl
Cancer Inst Monogr 2014; 2014: 236-243. https://doi.org/10.1093/jncimonographs/lgu020
PMid:25417237 PMCid:PMC4841168
- Le
Floch AC, Eisinger F, D'Incan E et al. Socioeconomic deprivation is
associated with decreased survival in patients with acute myeloid
leukemia. Cancer Epidemiol 2020; 66: 101699. https://doi.org/10.1016/j.canep.2020.101699
PMid:32179456
- Tao
L, Foran JM, Clarke CA et al. Socioeconomic disparities in mortality
after diffuse large B-cell lymphoma in the modern treatment era. Blood
2014; 123: 3553-3562. https://doi.org/10.1182/blood-2013-07-517110
PMid:24705494 PMCid:PMC4047495
- Shah
NN, Xi Y, Liu Y et al. Racial and Socioeconomic Disparities in Mantle
Cell Lymphoma. Clin Lymphoma Myeloma Leuk 2019; 19: e312-e320. https://doi.org/10.1016/j.clml.2019.03.006
PMid:31029647
- Kahn
JM, Keegan TH, Tao L et al. Racial disparities in the survival of
American children, adolescents, and young adults with acute
lymphoblastic leukemia, acute myelogenous leukemia, and Hodgkin
lymphoma. Cancer 2016; 122: 2723-2730. https://doi.org/10.1002/cncr.30089
PMid:27286322 PMCid:PMC4992431
- Han
X, Jemal A, Flowers CR et al. Insurance status is related to diffuse
large B-cell lymphoma survival. Cancer 2014; 120: 1220-1227. https://doi.org/10.1002/cncr.28549
PMid:24474436
- Ritter
AJ, Goldstein JS, Ayers AA, Flowers CR. Rural and urban patients with
diffuse large B-cell and follicular lymphoma experience reduced overall
survival: a National Cancer DataBase study. Leuk Lymphoma 2019; 60:
1656-1667. https://doi.org/10.1080/10428194.2018.1546855
PMid:30632824 PMCid:PMC6594869
- Rafiq
M, Hayward A, Warren-Gash C et al. Socioeconomic deprivation and
regional variation in Hodgkin's lymphoma incidence in the U.K.: a
population-based cohort study of 10 million individuals. BMJ Open 2019;
9: e029228. https://doi.org/10.1136/bmjopen-2019-029228
PMid:31542744 PMCid:PMC6756616
- Goldstein
JS, Nastoupil LJ, Han X et al. Disparities in survival by insurance
status in follicular lymphoma. Blood 2018; 132: 1159-1166. https://doi.org/10.1182/blood-2018-03-839035
PMid:30042094 PMCid:PMC6137560
- Ailawadhi
S, Azzouqa AG, Hodge D et al. Survival Trends in Young Patients With
Multiple Myeloma: A Focus on Racial-Ethnic Minorities. Clin Lymphoma
Myeloma Leuk 2019; 19: 619-623. https://doi.org/10.1016/j.clml.2019.06.010
PMid:31377212
- Fiala
MA, Finney JD, Liu J et al. Socioeconomic status is independently
associated with overall survival in patients with multiple myeloma.
Leuk Lymphoma 2015; 56: 2643-2649. https://doi.org/10.3109/10428194.2015.1011156
PMid:25651424 PMCid:PMC4831207
- Savage D, Lindenbaum J,
Van Ryzin J et al. Race, poverty, and survival in multiple myeloma.
Cancer 1984; 54: 3085-3094. https://doi.org/10.1002/1097-0142(19841215)54:12<3085::AID-CNCR2820541246>3.0.CO;2-Z
- Cowan
AJ, Allen C, Barac A et al. Global Burden of Multiple Myeloma: A
Systematic Analysis for the Global Burden of Disease Study 2016. JAMA
Oncol 2018; 4: 1221-1227. https://doi.org/10.1001/jamaoncol.2018.2128
PMid:29800065 PMCid:PMC6143021
- Gebregziabher
M, Bernstein L, Wang Y, Cozen W. Risk patterns of multiple myeloma in
Los Angeles County, 1972-1999 (United States). Cancer Causes Control
2006; 17: 931-938. https://doi.org/10.1007/s10552-006-0030-x
PMid:16841260
- Demers
PA, Vaughan TL, Koepsell TD et al. A case-control study of multiple
myeloma and occupation. Am J Ind Med 1993; 23: 629-639. https://doi.org/10.1002/ajim.4700230410
PMid:8338527
- Perrotta
C, Kleefeld S, Staines A et al. Multiple myeloma and occupation: a
pooled analysis by the International Multiple Myeloma Consortium.
Cancer Epidemiol 2013; 37: 300-305. https://doi.org/10.1016/j.canep.2013.01.008
PMid:23403129
- Sonoda
T, Ishida T, Mori M et al. A case-control study of multiple myeloma in
Japan: association with occupational factors. Asian Pac J Cancer Prev
2005; 6: 33-36.
- Landgren O, Rajkumar
SV,
Pfeiffer RM et al. Obesity is associated with an increased risk of
monoclonal gammopathy of undetermined significance among black and
white women. Blood 2010; 116: 1056-1059.
https://doi.org/10.1182/blood-2010-01-262394 PMid:20421448
PMCid:PMC2938127
- Koessel SL, Theis MK,
Vaughan TL et al. Socioeconomic status and the incidence of multiple
myeloma. Epidemiology 1996; 7: 4-8. https://doi.org/10.1097/00001648-199601000-00002
PMid:8664400
- Sun
T, Wang S, Sun H et al. Improved survival in multiple myeloma, with a
diminishing racial gap and a widening socioeconomic status gap over
three decades. Leuk Lymphoma 2018; 59: 49-58. https://doi.org/10.1080/10428194.2017.1335398
PMid:28595471
- Costa
LJ, Brill IK, Brown EE. Impact of marital Status, insurance status,
income, and race/ethnicity on the survival of younger patients
diagnosed with multiple myeloma in the United States. Cancer 2016; 122:
3183-3190. https://doi.org/10.1002/cncr.30183
PMid:27548407
- Hong
S, Rybicki L, Abounader D et al. Association of Socioeconomic Status
with Outcomes of Autologous Hematopoietic Cell Transplantation for
Multiple Myeloma. Biol Blood Marrow Transplant 2016; 22: 1141-1144. https://doi.org/10.1016/j.bbmt.2016.03.011
PMid:26995694
- Nandakumar
A, Armstrong BK, de Klerk NH. Multiple myeloma in Western Australia: a
case-control study in relation to occupation, father's occupation,
socioeconomic status and country of birth. Int J Cancer 1986; 37:
223-226. https://doi.org/10.1002/ijc.2910370209
PMid:3080376
- Harwood
M, Dunn N, Moore J et al. Trends in myeloma relative survival in
Queensland by treatment era, age, place of residence, and socioeconomic
status. Leuk Lymphoma 2019; 1-7.
- Chan
HSH, Milne RJ. Impact of age, sex, ethnicity, socioeconomic deprivation
and novel pharmaceuticals on the overall survival of patients with
multiple myeloma in New Zealand. Br J Haematol 2019. https://doi.org/10.1111/bjh.16238
PMid:31584720
- Renshaw
C, Ketley N, Moller H, Davies EA. Trends in the incidence and survival
of multiple myeloma in South East England 1985-2004. BMC Cancer 2010;
10: 74. https://doi.org/10.1186/1471-2407-10-74
PMid:20193064 PMCid:PMC2837016
- Rachet
B, Mitry E, Shah A et al. Survival from multiple myeloma in England and
Wales up to 2001. Br J Cancer 2008; 99 Suppl 1: S110-112. https://doi.org/10.1038/sj.bjc.6604607
PMid:18813241 PMCid:PMC2557530
- Nair MK, Varghese C,
Krishnan E et al. Survival in multiple myeloma in Kerala. Natl Med J
India 1993; 6: 7-10.
- Abou-Jawde
RM, Baz R, Walker E et al. The role of race, socioeconomic status, and
distance traveled on the outcome of African-American patients with
multiple myeloma. Haematologica 2006; 91: 1410-1413.
- Fonseca
R, Abouzaid S, Bonafede M et al. Trends in overall survival and costs
of multiple myeloma, 2000-2014. Leukemia 2017; 31: 1915-1921. https://doi.org/10.1038/leu.2016.380
PMid:28008176 PMCid:PMC5596206
- MacEwan
JP, Batt K, Yin W et al. Economic burden of multiple myeloma among
patients in successive lines of therapy in the United States. Leuk
Lymphoma 2018; 59: 941-949. https://doi.org/10.1080/10428194.2017.1361035
PMid:28805105
- Goodwin
JA, Coleman EA, Sullivan E et al. Personal financial effects of
multiple myeloma and its treatment. Cancer Nurs 2013; 36: 301-308. https://doi.org/10.1097/NCC.0b013e3182693522
PMid:23047800 PMCid:PMC3973128
- Merola
D, Yong C, Noga SJ, Shermock KM. Costs Associated with Productivity
Loss Among U.S. Patients Newly Diagnosed with Multiple Myeloma
Receiving Oral Versus Injectable Chemotherapy. J Manag Care Spec Pharm
2018; 24: 1019-1026. https://doi.org/10.18553/jmcp.2018.24.10.1019
PMid:30247101
[TOP]