Altinok Gunes B.1, Ozkan T.2, Karadag Gurel A.3, Dalkilic S.4, Belder N.5, Ozkeserli Z.5, Ozdag H.5, Beksac M.6, Sayinalp N.7, Yagci A. M.8 and Sunguroglu A.2.
1 Vocational School of Health Services, Ankara University, Ankara, Turkey.
2 Department of Medical Biology, Faculty of Medicine, Ankara University, Ankara, Turkey.
3 Department of Medical Biology, Faculty of Medicine, Usak University, Usak, Turkey.
4 Department of Molecular Biology, Faculty of Science, Firat University, Elazig, Turkey.
5 Ankara University Biotechnology Institute, Ankara, Turkey.
6 Department of Hematology, Faculty of Medicine, Ankara University, Ankara, Turkey.
7 Department of Internal Medicine, Faculty of Medicine, Hacettepe University, Ankara, Turkey .
8 Department of Internal Medicine, Faculty of Medicine, Gazi University, Ankara, Turkey.
Correspondence to:
Buket Altinok Gunes, PhD. Ankara University, Vocational School of
Health Services, 06290 Ankara, Turkey. Tel: 00903123573242/6642.
E-mail:
baltinok@ankara.edu.tr. Orcid: 0000-0002-8852-6626
Tulin Ozkan, Assoc. Prof. Ankara University, Faculty of Medicine, Department of Medical Biology, Ankara, Turkey. E-mail:
tozkan@ankara.edu.tr, orcid: 0000-0002-1431-2385
Aynur Karadag Gurel, Assoc. Prof. Usak University, Faculty of Medicine, Department of Medical Biology, Usak, Turkey.E-mail:
aynur.karadag@usak.edu.tr Orcid: 0000-0002-5499-5168
Published: July 01, 2024
Received: February 12, 2024
Accepted: June 18, 2024
Mediterr J Hematol Infect Dis 2024, 16(1): e2024058 DOI
10.4084/MJHID.2024.058
This is an Open Access article distributed
under the terms of the Creative Commons Attribution License
(https://creativecommons.org/licenses/by-nc/4.0),
which permits unrestricted use, distribution, and reproduction in any
medium, provided the original work is properly cited.
|
|
Abstract
Background:
Acute myeloid leukaemia(AML) is a disease of the haematopoietic stem
cells(HSCs) that is characterised by the uncontrolled proliferation and
impaired differentiation of normal haematopoietic stem/progenitor
cells. Several pathways that control the proliferation and
differentiation of HSCs are impaired in AML. Activation of the
Wnt/beta-catenin signalling pathway has been shown in AML and
beta-catenin, which is thought to be the key element of this pathway,
has been frequently highlighted. The present study was designed to
determine beta-catenin expression levels and beta-catenin-related genes
in AML.
Methods: In this
study, beta-catenin gene expression levels were determined in 19 AML
patients and 3 controls by qRT-PCR. Transcriptome analysis was
performed on AML grouped according to beta-catenin expression levels.
Differentially expressed genes(DEGs) were investigated in detail using
the Database for Annotation Visualisation and Integrated
Discovery(DAVID), Gene Ontology(GO), Kyoto Encyclopedia of Genes and
Genomes(KEGG), STRING online tools.
Results:
The transcriptome profiles of our AML samples showed different
molecular signature profiles according to their beta-catenin
levels(high-low). A total of 20 genes have been identified as hub
genes. Among these, TTK, HJURP, KIF14, BTF3, RPL17 and RSL1D1 were found to be associated with beta-catenin and poor survival in AML. Furthermore, for the first time in our study, the ELOV6
gene, which is the most highly up-regulated gene in human AML samples,
was correlated with a poor prognosis via high beta-catenin levels.
Conclusion:
It is suggested that the identification of beta-catenin-related gene
profiles in AML may help to select new therapeutic targets for the
treatment of AML.
|
Introduction
Acute
Myeloid Leukemia (AML) is a hematopoietic stem cell (HSC) disorder. It
is characterized by the transformation of myeloid progenitor cells,
which normally differentiate into mature blood cells during
hematopoiesis, into clonally expanding neoplastic cells, resulting in a
loss of their differentiation capacity.[1] Normal stem
cells, which possess the ability to self-renew, can undergo neoplastic
transformation due to mutations in genes associated with signaling
pathways, as well as epigenetic or gene expression changes. In this
regard, the Wnt signaling pathway, which is active especially in the
embryonic period and in various cancer types, has been extensively
reported in the literature in recent years.[2-4]The Wnt signaling pathways are classified as canonical (beta-catenin dependent) or non-canonical (beta-catenin independent).[5]
The beta-catenin protein undergoes hypophosphorylation and
stabilization as a result of canonical Wnt pathway activation, which is
crucial for stem cell maintenance. The CTNNB1 gene encodes the protein
beta-catenin, which has multiple functions linked to clonogenic growth
of cells, differentiation, and apoptosis both in vitro and in vivo.
This protein is stabilized in the cytoplasm and transported into the
nucleus under the control of the canonical Wnt pathway.[5]
In
the absence of a Wnt ligand, the main mediator, beta-catenin, is
constitutively phosphorylated by a destruction complex made up of GSK3β, CK1, Axin, and APC, making it a target for degradation by the proteasome. When Wnt ligands bind to Frizzled and LRP5/6,
which are Wnt receptors, the destruction complex becomes saturated with
phosphorylated beta-catenin (which cannot be destroyed), causing
cytosolic accumulation of non-phosphorylated beta-catenin.[6] From there, beta-catenin ultimately translocates into the nucleus; it displaces Groucho and binds to TCF/LEF, resulting in the activation of proto-oncogenic Wnt target genes.[7]
Numerous
studies on the gene expression levels of beta-catenin, an essential
component of the Wnt pathway, have been reported in the literature.
Serinsöz et al. (2004),[8] Simon et al. (2005),[9] Ysebaert et al. (2006),[10] Xuet al. (2008),[11] Chen et al. (2009),[12] Gandillet et al. (2011).[13], Li et al. (2018),[5], Jiang et al. (2018),[14] Morgan et al. (2019),[6] Wagstaff et al. (2022)[7] and Han et al. (2022)[15]
are among the research that have made major contributions. These
studies, conducted in a consistent manner, have revealed significant
differences in beta-catenin expression levels among AML patient groups.
In
this study, the main objective was to investigate the gene expression
profiles of beta-catenin in patients with AML and to determine the
status of beta-catenin levels among AML patient groups. Our data showed
that the transcriptome profiles of AML samples, which were categorized
into two groups based on the expression levels of the beta-catenin
gene, were different from the transcriptome profiles of healthy control
samples. The differentially expressed gene sets were then examined by
cluster analysis. It has been observed that a significant signature is
obtained from the comparison of transcriptome profiles between AML
patient groups with high and low levels of beta-catenin. Furthermore,
the biological functions, altered signaling pathways, and
protein-protein interaction network of these DEGs were analyzed and
discussed. This study is the first global transcriptomic investigation
conducted in AML based on the levels of beta-catenin, the key component
of the Wnt signaling pathway. In our study, the identification of
beta-catenin-associated genes and pathways that play a crucial role in
cancer development can provide important insights into the molecular
biology of AML. In addition, novel diagnostic, prognostic, and
therapeutic candidates may be discovered.
Materials and Methods
Sample collection.
Blood or bone marrow samples of a total of 19 newly-diagnosed (7 female
and 12 male) AML patients and 3 healthy bone marrow donors who have not
been previously diagnosed with any malignant disease in the Department
of Hematology, Faculty of Medicine, Ankara, Gazi, and Hacettepe
University was included in this study. The median age was 54 years, and
the median white blood cell count was 48 689. The patients were
diagnosed according to the FAB (French-American-British) classification
criteria. Ankara University Faculty of Medicine ethics committee
(reference number and date: 123-3355 and 07.01.2008) approved this
study, and written informed consents were obtained from them or their
relatives.
Isolation of CD34+ cells from the bone marrow or blood of AML patients and controls.
Mononuclear cells were purified from the blood or bone marrow by
density gradient centrifugation using Ficoll-Paque (PAA Laboratories,
Austria). After centrifugation (1200g, 20 min, 200C), mononuclear cells
obtained from the interface were washed with phosphate-buffered saline
(PBS, Sigma). The CD34+ cells were isolated from the mononuclear cells
using positive immunomagnetic selection (EasySep CD34 positive
selection kit, Stem cell Technologies, Canada) according to the
manufacturer's protocol. Isolated CD34+ cells were cultured for 2 days
at 37°C and 5% CO2 using Stemspan H3000 (Stem Cell Technologies,
Canada), a special medium for hematopoietic stem cells, and Stemspan
CC100 (Stem Cell Technologies, Canada) cytokine mixture. 4-5x10⁵
cells/ml were obtained. The purity of cultured CD34+ cells from AML
patients and healthy controls was determined by flow cytometry using
CD34.PerCP, CD45.FITC, CD33.PE(BD Biosciences, San Jose, CA, USA) and was greater than 97% in samples used for microarray analysis.
RNA isolation. Total
RNA was isolated from CD34+ cells using Trizol reagent according to the
manufacturer's protocol (Invitrogen, ABD). Total RNA quality and
quantity were evaluated using a NanoDrop ND-1000 Spectrophotometer
(NanoDrop Technologies, Wilmington, DE, USA), an Agilent 2100
Bioanalyzer RNA 6000 (Agilent Technologies, Santa Clara, CA), and
agarose gel electrophoresis.
Real-time quantitative PCR.
Beta-catenin expression was analyzed in AML patients compared to
controls using the real-time quantitative PCR method. 1µg of total RNA
was reverse-transcribed using random hexamers with Roche Transcriptor
High Fidelity cDNA synthesis kit according to the manufacturer's
protocol. Real-time amplification was performed with Light Cycler 480
SYBR Green Master Mix (Roche Applied Sciences, Manheim, Germany)
performed on Light Cycler 480 Instrument (Roche Applied Sciences,
Manheim, Germany). For normalization, hypoxanthine
phosphoribosyltransferase (hprt) endogenous control was selected.
Beta-catenin and hprt primers designed using the Perl Primer software
were as follows: beta-catenin forward primer:5'- ATTACAACTCTCCACAACCT,
beta-catenin reverse primer: 5'- CAGACAGATAGCACCTTCAG and hprt forward primer: 5'- TGACACTGGCAAAACAATGCA,hprt reverse primer: 5'- GGTCCTTTTCACCAGCAAGCT. Relative beta-catenin expression levels were calculated using the 2-ΔΔCt method.[16]
Gene Expression Profiling.
19 AML and 3 healthy control samples were analyzed by microarray
analysis. 500 ng of total RNA isolated from each sample was used to
generate amplified and biotinylated cRNA with the GeneChip® 3′ IVT
Express Kit (Affymetrix, Santa Clara, CA). 15 µg of fragmented
biotin-labeled cRNA was hybridized with Human Genome U133 Plus 2.0
Affymetrix GeneChips (Affymetrix, Santa Clara, CA, USA) for 18 hours at
450C. Arrays were washed, stained, and finally scanned using the
GeneChip® Scanner 3000 according to the Affymetrix procedure.
Microarray Data Analysis.
AffymetrixGeneChip Command Console software was used to preprocess all
of the raw data (CEL files) (version 3.0.1). The expression algorithm
used by Affymetrix MAS 5.0 to create the % present calls. Partek
Genomic Suite 6.6 software (Partek Inc., St. Louis, MO, USA) was used
for analyzing gene expression data. Briefly, robust multiarray
averaging (RMA) was used to import the data and normalize it. Filtering
the list of transcripts that were differentially expressed was done
using a fold change threshold of >1.5 and p < 0.05 limits.
Optimized false discovery rate (FDR) was used to calculate adjusted P
values, often known as q values.[17] The FDR cutoff
was q < 0:05, which was seen as significant. The relationships
between the AML and control groups were evaluated using unsupervised
hierarchical clustering. The microarray data analyses are summarized in
Supp. Figure 1. Microarray data are available at http://www.ncbi.nlm.nih.gov/geo/ (accession no. GSE245305).
Gene ontology and pathway enrichment analyses. The Database for Annotation Visualization and Integrated Discovery (DAVID) (version 6.8) (https://david.ncifcrf.gov/)
was used to analyze Gene Ontology (GO) and Kyoto Encyclopedia of Genes
and Genomes (KEGG) pathway enrichment analysis. A statistically
significant difference was defined as p<0.05.
Protein protein interaction (PPI) network. The Search Tool for the Retrieval of Interacting Genes/Proteins (STRING) database v10.0 (http://www.stringdb.org/) is an online tool created to analyze the information on protein-protein interaction (PPI).[18]
AML-related DEGs were mapped to STRING to evaluate the PPI data; a
confidence score of >0.9 was used as the cutoff value, and Cytoscape
software (version 3.8.2, www.cytoscape.org) was used to display the
results. Statistical significance was defined as a P value less than
0.05. In addition, modules of the PPI network were screened in
Cytoscape 3.6.1 using Network Analyzer and the Molecular Complex
Detection (MCODE) plugin (degree cutoff = 2, node score cutoff = 0.2,
k-core = 2, and max. depth =100). To identify potential "hub" proteins
in Cytoscape, betweenness centrality degrees were calculated.[19]
Survival Analysis of Hub Genes.
The median relative expression of genes in the Gene Expression Profile
Interactive Analysis (GEPIA) database was used as a cutoff value for
determining the prognostic significance of hub genes in AML. The Log
Rank test was used to plot and analyze the survival curves for crucial
beta-catenin-related genes in AML. The hazard ratio (HR) and 95%
confidence interval (CI) were plotted on the survival curve. It was
determined to be statistically significant when p < 0.05.
GEPIA
is an online tool used to validate the relative expression of selected
center genes. Cancer Genome Atlas (TCGA) and Genotype-Tissue
Expression, GEPIA (http://gepia.cancer-pku.cn/)
provide data on gene expression and survival and are frequently used to
evaluate gene expression between cancer and normal samples.[20]
Validation of Microarray Data.
DEG lists were used to select genes for microarray validation (Supp.
data). Real-time quantitative PCR was performed to validate microarray
gene expression data. Relative gene expression of Grb-2, Nf-kb, and Gsk3ß genes between AML and control groups were calculated using 2-ΔΔCtmethod. The expression levels of target genes have been normalized to the hprt endogenous control. The ratio of AML/control groups was calculated as the fold change in expression.
Statistical data analysis.
The Student's t-test and one-way ANOVA were both used for group
comparisons, with the Tukey test for pairwise comparisons used for
statistically significant ANOVA p values. SPSS Statistics version 20
(IBM SPSS Statistics, Chicago, Illinois) was used for all statistical
analyses. p < 0.05 was considered to be statistically significant.
We identified differentially expressed genes concerning the 1.5-fold
change threshold. Mann–Whitney U test was applied to compare the qPCR
gene expression values between AML patients and control groups. P
values are adjusted using the Benjamini- Hochberg procedure. False
discovery rates (FDR) of less than 10% were considered statistically
significant. Statistical significance was set at p<0.05.
Results
Isolation and Characterization of CD34+ Cells of AML Patients and Controls.
AML patients' and healthy control samples' primary cultivated CD34+
cells preserved the CD34+ phenotype at a rate of 98% after culture, and
all patient and healthy controls that maintained the CD34+ phenotype
were subjected to microarray analysis (Supp. Figure 2).Beta-Catenin Expression Levels in AML Patients and Controls.
Beta-catenin expression profiles were analyzed prior to microarray
analysis in 19 AML patients compared to controls. 8 AML patients had
high beta-catenin gene expression levels (Group 1), while 7 AML
patients had low beta-catenin gene expression levels (Group 2). In 4
AML patients, there was no significant increase or decrease (p<0.05,
Figure 1).
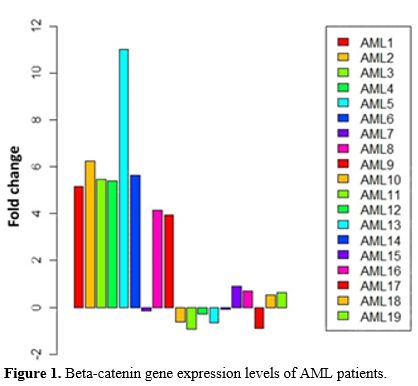 |
- Figure 1. Beta-catenin gene expression levels of AML patients.
|
The study was completed on two groups: Group 1; AML patient group with high beta-catenin levelsGroup 2; AML patient group with low beta-catenin levels Correlation Between Beta-Catenin Expression and Common Clinical Features in Patients.
The expression levels of the beta-catenin gene in AML patients did not
correlate with the clinical characteristics of the patients (p>005) (Supp. Table 1). Identification of Differentially Expressed Genes.
According to the venn diagram, when AML patients with high beta-catenin
levels were compared to healthy controls (high vs control group), 2889
genes (1619 up- and 1270 down-regulated genes) were differentially
expressed (DEGs), whereas 904 genes (576 up- and 328 down-regulated
genes) were differentially expressed when AML patients with low
beta-catenin levels were compared to controls (low vs control group)
after the microarray analysis (Figure 2).
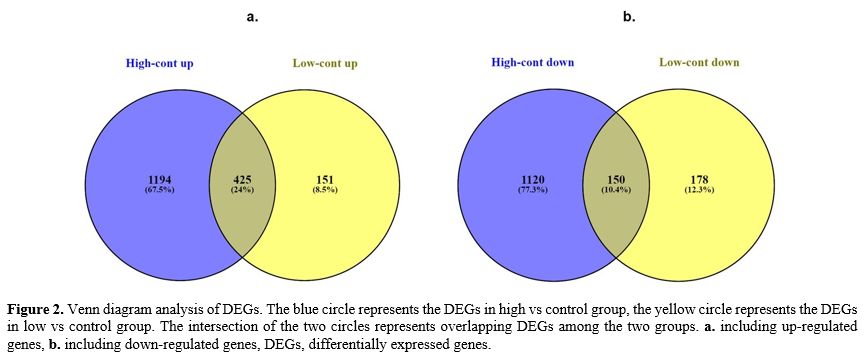 |
- Figure 2. Venn diagram
analysis of DEGs. The blue circle represents the DEGs in high vs
control group, the yellow circle represents the DEGs in low vs control
group. The intersection of the two circles represents overlapping DEGs
among the two groups. a. including up-regulated genes, b. including
down-regulated genes, DEGs, differentially expressed genes.
|
In
order to identify beta-catenin related genes in the AML group, we
focused on genes other than DEGs that were common in the venn diagrams
of two distinct groups, high vs control and low vs control. These
uncommon genes were the target of all analyses. Independent
of the common gene cluster, we chose 2314 DEGs (1194 up- and 1120
down-regulated genes) in the AML group with high beta-catenin levels
(high vs control). Similar to this, only 329 DEGs (151 up- and 178
down-regulated genes) were differentially expressed in the AML group
with low beta-catenin levels (low vs cont) (Figure 2). The
transcriptome profiles of the AML samples showed different molecular
signature profiles according on their beta-catenin levels (high-low)
when compared to the healthy control group. Figure 3 and 4 show heat maps for DEGs between the two groups.
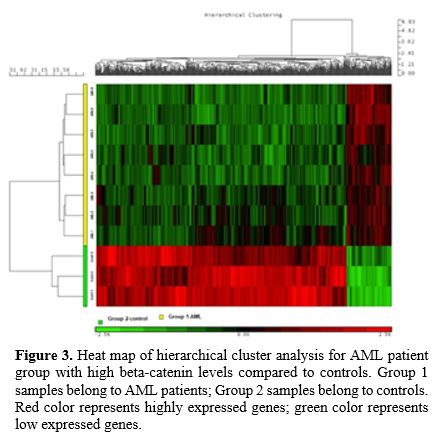 |
Figure 3. Heat map of
hierarchical cluster analysis for AML patient group with high
beta-catenin levels compared to controls. Group 1 samples belong to AML
patients; Group 2 samples belong to controls. Red color represents
highly expressed genes; green color represents low expressed genes. |
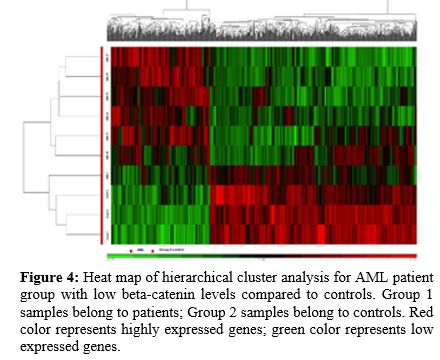 |
Figure 4. Heat map of
hierarchical cluster analysis for AML patient group with low
beta-catenin levels compared to controls. Group 1 samples belong to
patients; Group 2 samples belong to controls. Red color represents
highly expressed genes; green color represents low expressed genes.
|
The DEGs that are top upregulated and downregulated among the 2 groups are listed in Table 1.
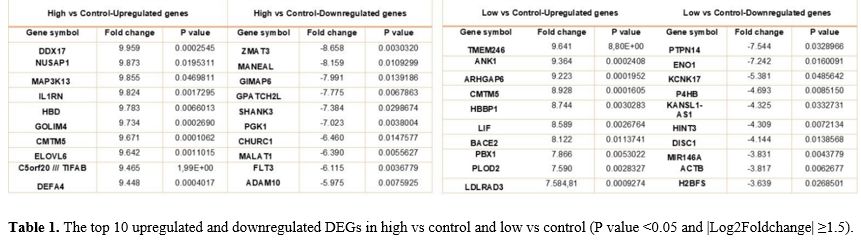 |
- Table 1. The top 10
upregulated and downregulated DEGs in high vs control and low vs
control (P value <0.05 and |Log2Foldchange| ≥1.5).
|
Gene Ontology, DAVID and KEGG Pathways Analysis.
GO, DAVID, and KEGG pathway analysis software were used to complete
functional and pathway enrichment analyses of genes with increasing or
reducing expression in order to better understand the function and
mechanism of DEGs identified through microarray data analysis. The
groups were compared with the control groups.Comparison-High vs Control Groups.
The results of the GO analysis (including Molecular Function,
Biological Process and Cellular Component) indicated changes in the
biological processes of up-regulated DEGs that were mainly enriched for
ATP binding, cell division, protein phosphorylation, cell-cell adherens
junction, m-RNA splicing, DNA repair, and beta-catenin -TCF complex
assembly. Furthermore, enrichment of down-regulated DEGs was mostly in
molecular function and biological processes, including metal ion
binding, regulation transcription, ATP binding, protein ubiquitination,
cell cycle and protein dephosphorylation (Figure 5).
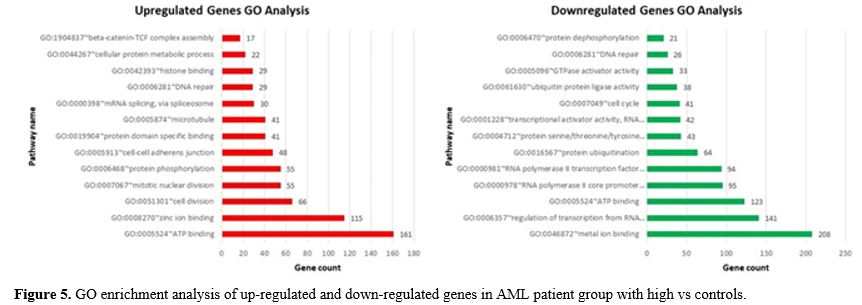 |
- Figure 5. GO enrichment analysis of up-regulated and down-regulated genes in AML patient group with high vs controls.
|
To
learn more about biological pathway alterations in the AML group with
high beta-catenin levels, the KEGG pathway was studied, and it was
discovered that many DEGs in the KEGG pathway were significantly
enriched. Significant pathway enrichment results are listed in Table 2. As indicated in Table 2,
the major pathways were protein processing in endoplasmic reticulum,
proteoglycans in cancer, Rap1 signaling pathway, cellular senescence,
autophagy, pathways in cancer, endocytosis, ubiquitin mediated
proteolysis, transcriptional misregulation in cancer, apoptosis and
necroptosis pathways.
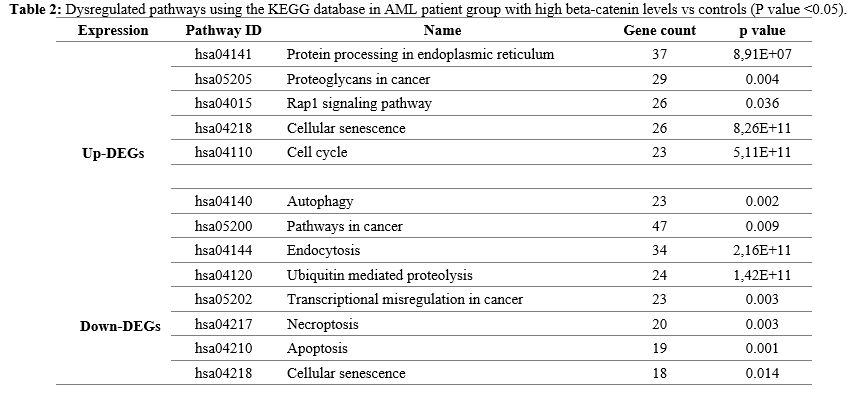 |
- Table 2. Dysregulated
pathways using the KEGG database in AML patient group with high
beta-catenin levels vs controls (P value <0.05).
|
Comparison-Low vs Control Groups.
For biological processes, the up-regulated DEGs were mainly enriched in
nucleus, nucleoplasm, ATP binding, cell division and DNA repair,
whereas the down-regulated DEGs were significantly enriched in
regulation of transcription from RNA polymerase II promoter, integral
component of plasma membrane, cell adhesion, protein phosphorylation,
protein serine/threonine/tyrosine kinase activity, microtubule and cell
cycle. Figure 6 shows all of the detailed GO term enrichment analysis findings.
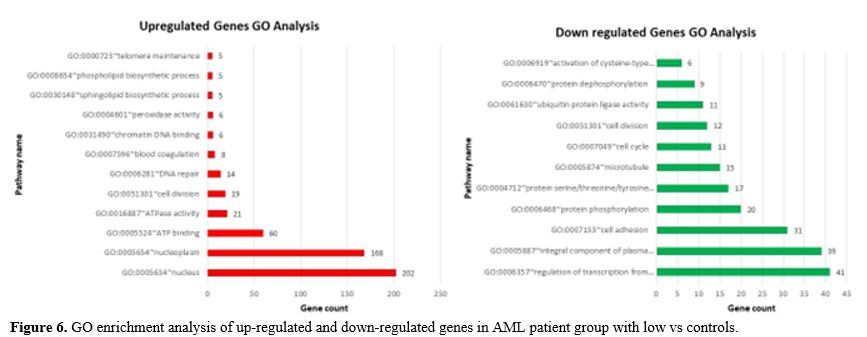 |
- Figure 6. GO enrichment analysis of up-regulated and down-regulated genes in AML patient group with low vs controls.
|
For
overall DEGs, a KEGG pathway analysis was also performed in the AML
group with low beta-catenin levels. Significant pathway enrichment
results are listed in Table 3.
According to the results, DEGs were obviously enriched in hematopoietic
cell lineage, signaling pathways regulating pluripotency of stem cells,
ECM-receptor interaction, ferroptosis, pathways in cancer, regulation
of actin cytoskeleton, MAPK signaling pathway (Table 3).
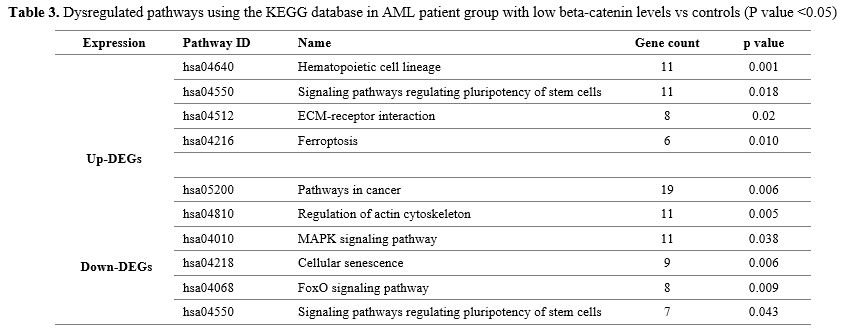 |
- Table 3. Dysregulated
pathways using the KEGG database in AML patient group with low
beta-catenin levels vs controls (P value <0.05)
|
Most of the DEGs were significantly enriched in cell cycle and regulating pluripotency of stem cells signaling pathways. Cell Cycle Pathway.
In our study, we observed differentially expression of many gene groups
related with the cell cycle pathway in the AML group with high
beta-catenin levels compared to controls (Figure 7). The expression of the genes ANAPC15,
YWHAB, PRKDC, TTK, CDC25C, SMC3, CDC25A, CDC14A, CDC25B, CDC14B, RBL2,
CDC20, CCNB2, CCNB1, DBF4, STAG2, TFDP1, CDK6, PTTG1, RAD21, CDC27,
ANAPC5, MAD1L1 in this pathway increased in the AML group with high beta-catenin levels.
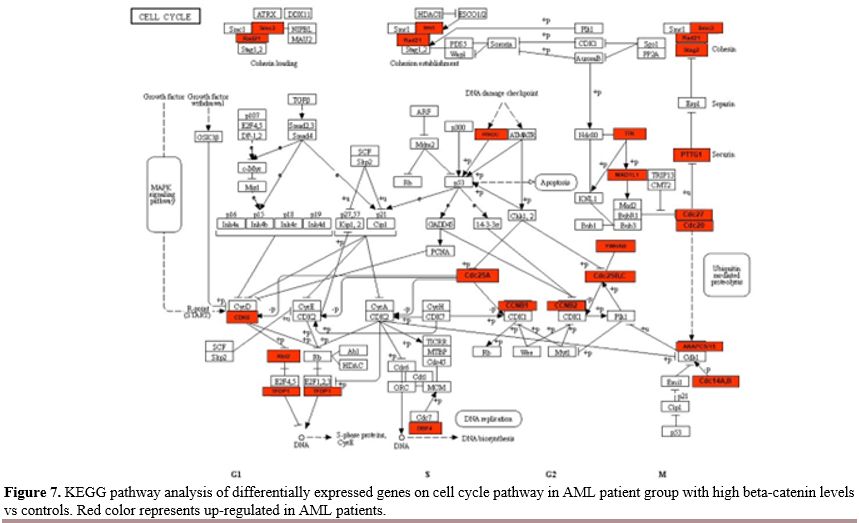 |
- Figure 7. KEGG pathway
analysis of differentially expressed genes on cell cycle pathway in AML
patient group with high beta-catenin levels vs controls. Red color
represents up-regulated in AML patients.
|
Signaling Pathways Regulating Pluripotency of Stem Cells. Another pathway in which genes are enriched in significant amounts is the regulating pluripotency of stem cells pathway (Figure 8).
We compared the expression of genes with increased and decreased
expression in this pathway between the AML patient group with low
beta-catenin levels and controls. The 7 downregulated significant genes
were MAPK11, SMAD4, MAP2K2, APC, SETDB1, CTNNB1, PIK3R1 and 11 upregulated significant genes were GSK3B, FZD3, BMPR2, RIF1, LIF, PIK3R3, TCF3, IGF1, IL6ST, SMAD5, JAK1.
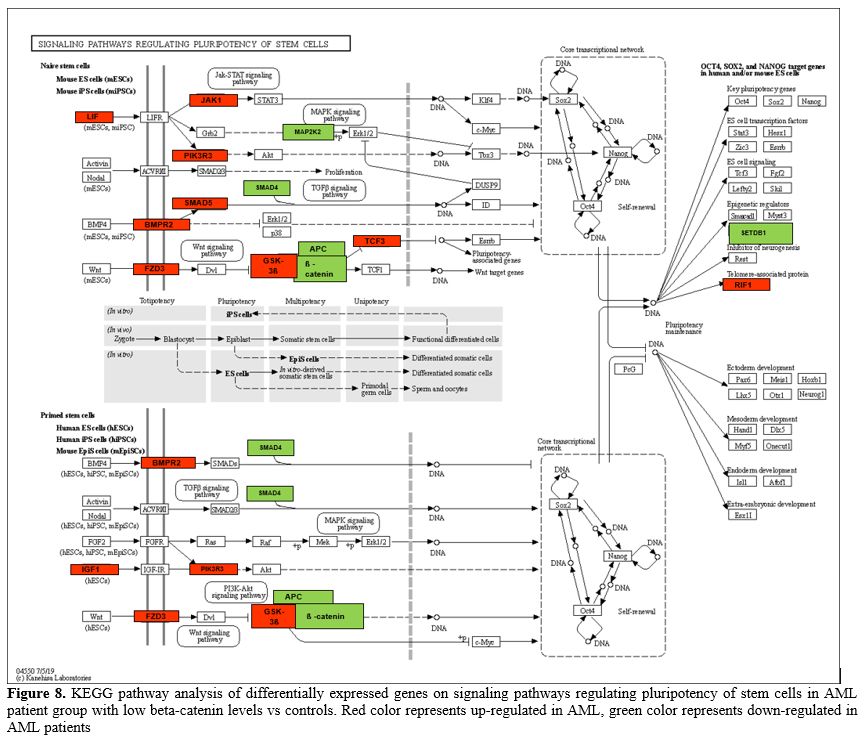 |
- Figure 8. KEGG pathway
analysis of differentially expressed genes on signaling pathways
regulating pluripotency of stem cells in AML patient group with low
beta-catenin levels vs controls. Red color represents up-regulated in
AML, green color represents down-regulated in AML patients
|
Protein-Protein İnteraction (PPI) Network Analysis.
Further, we performed to better understand the functional modules in
the PPI networks of the DEGs unique to AML patients in order to
identify the beta-catenin -related key genes for this disease. The
creation of a protein interaction network allows for the rapid analysis
of gene interactions. The PPI network of DEGs identified in CD34+ cells
of AML patients with high and low beta-catenin levels compared to
healthy controls was analyzed using the STRING online database and
Cytohubba plugin in Cytoscape software. Only in AML patients with high
beta-catenin levels (high vs cont) were 722 nodes and 1970 edges,
including 1194 up-regulated genes, and 614 nodes and 1463 edges,
comprising 1120 down-regulated genes, identified. 38 nodes and 32
edges, including 151 up-regulated genes, 46 nodes and 45 edges,
including 178 down-regulated genes, were identified only in AML
patients with low beta-catenin levels (low vs cont).In
the PPI network, hub genes were identified based on their degree and
MCC (maximum correlation criterion) score. Following these analyses, it
was discovered that 20 hub genes with different expression levels in
both groups (high vs cont - low vs cont) played a critical role.
Additionally, when networks are examined after PPI analysis, of the 20
hub (key) genes with highest expression on cell cycle pathway that were
identified in AML progression in the present study were: CDC20,
KIF20A, CCNB2, CENPE, AURKA, CCNB1, PBK, TTK, DLGAP5, CENPF, MKI67,
SPAG5, NEK2, BIRC5, PTTG1, HJURP, FOXM1, HMMR, KIF14, ANLN (High vs cont) (Figure 9a-b). 18 hub genes involved in ribosome biogenesis, (RSL24D1, PNO1, DIEXF, RSL1D1, PWP1, GNL3, NMD3, DHX15, UTP23, RPS5, RPS23, RPS24, DIMT1, RPL15, RPL37A, RPL22, C18orf32, DDX31) and 2 hub genes (TFB2M, BTF3) acting as transcription factors were down-regulated in AML group with high beta-catenin level (High vs cont) (Figure 9a-c).
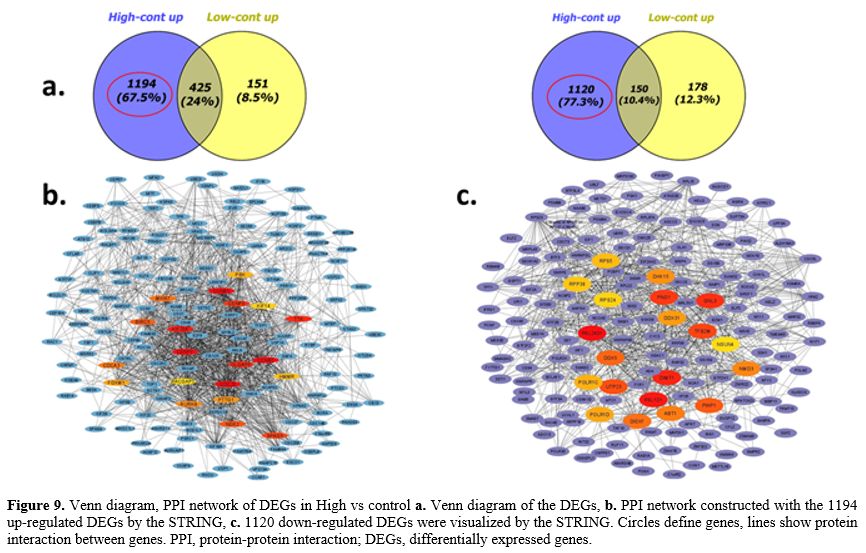 |
- Figure 9. Venn
diagram, PPI network of DEGs in High vs control a. Venn diagram of the
DEGs, b. PPI network constructed with the 1194 up-regulated DEGs by the
STRING, c. 1120 down-regulated DEGs were visualized by the STRING.
Circles define genes, lines show protein interaction between genes.
PPI, protein-protein interaction; DEGs, differentially expressed genes.
|
The highest node degree was found in four hub genes with high expression involved in DNA repair (BLM, FANCD2, FANCI, EME1) and four other genes involved in porphyrin metabolism (PPOX, FECH, ABCB6, UROS). The up-regulated TFRC, FTH1 hub genes involved in ferroptosis, as well as BDNF, CDH2, GYPA and IL17 involved in hematopoietic cell lineage, were identified to have a central role in AML group with low beta-catenin level. IGF1, PIK3R3, and GSK3ß hub genes are all able to regulate stem cell pluripotency. TLE1, BCLAF1, and RBPJ genes interact as transcription factors. All these hub genes had high expression in AML group with low beta-catenin level (Figure 10a-b). Among the down-regulated hub genes, CTNNB1 (beta-catenin), HIST1H2BD,
KAT5, HIST1H2BK, PIK3R1, INPP5D, H3F3A, RUNX2, DOK1, RAB3GAP1, NCK2,
DCTN4, NUDT3, KDM4B, EXOC7, VAMP4, OGT, ING4, ARRB1, MAP2K2 had
the highest node degree in AML group with low beta-catenin level. These
genes had central roles in multiple pathways, including stem cell
pluripotency, epigenetic regulation, PI3K/AKT and MAPK signaling
pathway, membrane trafficking pathway, GTPase activity, tumor
supressor, metabolic signaling pathway (Low vs cont) (Figure 10a-c).
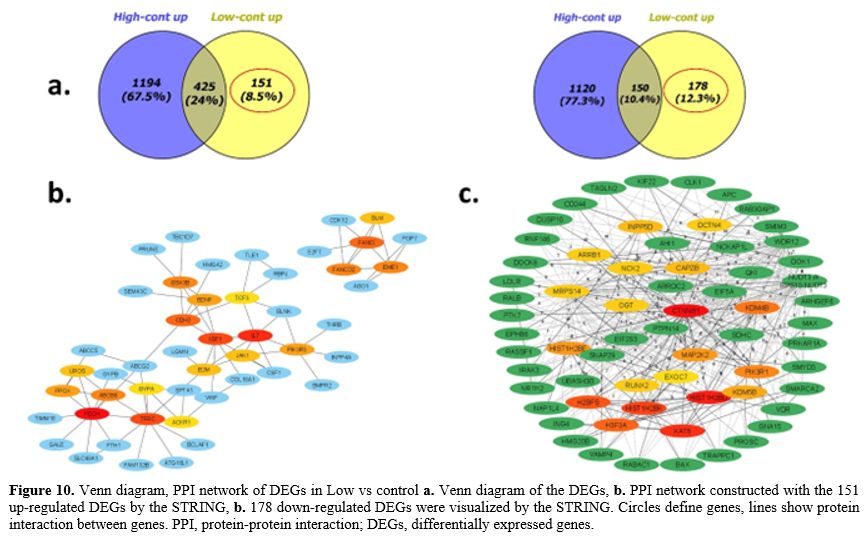 |
- Figure 10. Venn
diagram, PPI network of DEGs in Low vs control a. Venn diagram of the
DEGs, b. PPI network constructed with the 151 up-regulated DEGs by the
STRING, b. 178 down-regulated DEGs were visualized by the STRING.
Circles define genes, lines show protein interaction between genes.
PPI, protein-protein interaction; DEGs, differentially expressed genes.
|
To
identify hub genes in this PPI network, the important module was
evaluated using the Cytohubba software plug-in MCODE. Analysis of
up-regulated genes found 305 edges and 26 nodes in the high vs control
group. There were 137 edges and 23 nodes identified for down-regulated
genes. Six clusters with high MCODE score (score>5) were
investigated and hub genes were listed in Table 4 (score>5) (High vs cont).
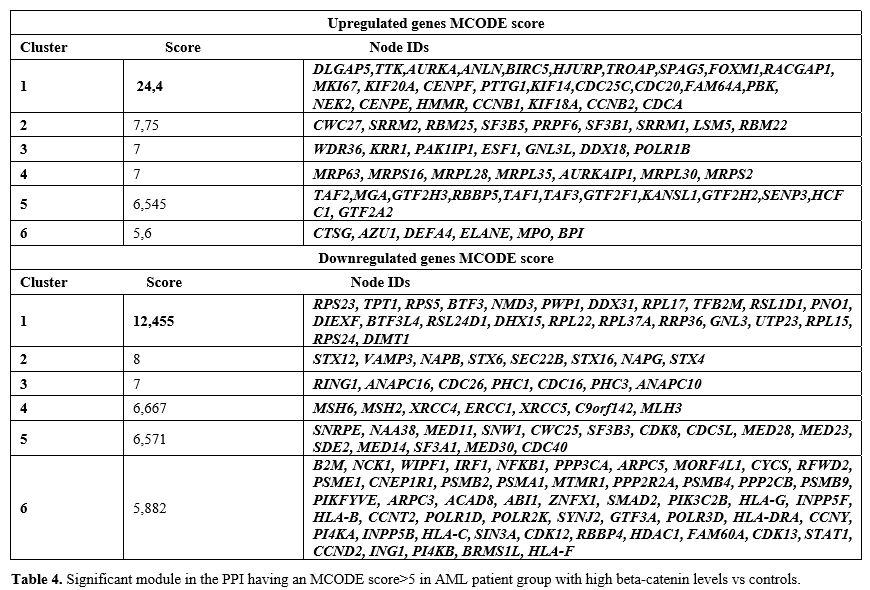 |
- Table 4. Significant
module in the PPI having an MCODE score>5 in AML patient group with
high beta-catenin levels vs controls.
|
The first cluster with the highest MCODE score consisted of upregulated genes (DLGAP5,
TTK, AURKA, ANLN, BIRC5, HJURP, TROAP, SPAG5, FOXM1, RACGAP1, MKI67,
KIF20A, CENPF, PTTG1, KIF14, CDC25C, CDC20, FAM64A, PBK, NEK2, CENPE,
HMMR, CCNB1, KIF18A, CCNB2, CDCA) (Supp. Fig 4), which were primarily associated with the cell cycle pathway. On the other hand, the downregulated genes (RPS23,
TPT1, RPS5, BTF3, NMD3, PWP1, DDX31, C18orf32 /// RPL17 ///
RPL17-C18orf32, TFB2M, RSL1D1, PNO1, DIEXF, BTF3L4, RSL24D1, DHX15,
RPL22, RPL37A, RRP36, GNL3, UTP23, RPL15, RPS24, DIMT1) (Supp. Figure 4) were mainly associated with ribosome biogenesis and transcription factors (High vs cont).In
the low vs control group, two clusters were selected for genes with
high scores (score>3) identified through MCODE analysis,
representing upregulated genes, while a single cluster was chosen for
downregulated genes, which is the most significant cluster (Table 5).
The upregulated genes in cluster 1 were significantly enriched in DNA
repair. Additionally, the genes in cluster 2 were predominantly
associated with porphyrin metabolism (Supp. Figure 5).
Furthermore, the downregulated genes in cluster 1 were primarily
enriched in the regulation of actin filaments, DNA repair, and GTPase
activity (Supp. Figure 5). The detailed information about the top 3 clusters was shown in Table 5.
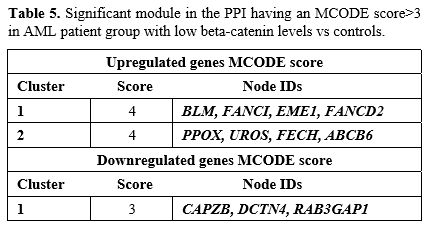 |
- Table 5. Significant module in the PPI having an MCODE score>3 in AML patient group with low beta-catenin levels vs controls.
|
Prognostic Analysis of the Hub Genes.
Survival analysis was performed on 20 prominent genes that were
enriched in both KEGG and GO pathways, as well as between hub genes,
using the GEPIA online resource database (Figure 11).
With
the use of the GEPIA database, survival analysis was performed to
analyze the relationship between the prognosis of AML patients and the
expression of genes related to beta-catenin that were significant in
our study. According to the findings, there may be a relationship
between patient prognosis and expression differences because seven
genes expression levels were found to be strongly correlated with the
overall survival (OS) of AML patients. TTK, HJURP, KIF14, BTF3,
C18orf32/RPL17, RSL1D1, and ELOV6 genes have been proposed as potential
prognostic markers for AML patients with high beta-catenin levels (Figure 11).
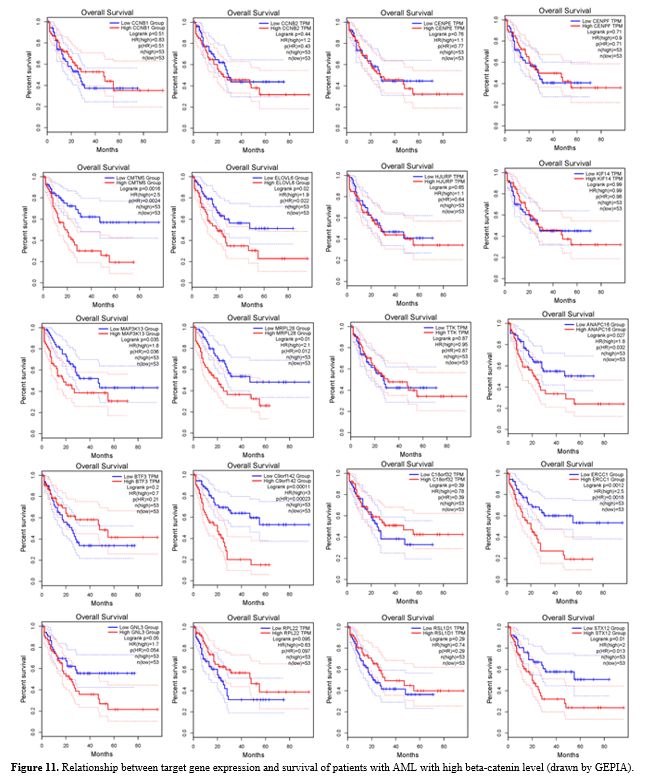 |
- Figure 11.
Relationship between target gene expression and survival of patients
with AML with high beta-catenin level (drawn by GEPIA).
|
Validation Microarray data.
To validate the microarray analysis results, genes were selected from
among the most differentially expressed genes in our dataset. Among the
genes of interest, three genes (Grb-2, Klf4,Gsk3ß) showed parallel
expression patterns with the microarray data and exhibited statistical
significance (Supp. Figure 3).
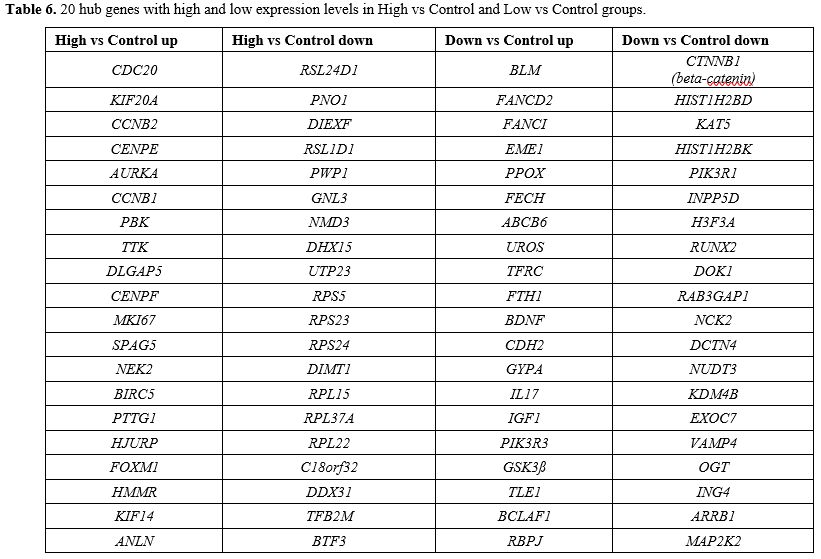 |
- Table 6. 20 hub genes with high and low expression levels in High vs Control and Low vs Control groups.
|
Discussion
In
spite of the development of treatment possibilities, AML is still the
most common haematological malignancy in terms of incidence and
cancer-related deaths.[21] It has also been known for over 15 years that beta-catenin dysregulation[15]
in AML promotes the development, protection and drug resistance of
leukaemia stem cells. Despite this knowledge, β-catenin inhibitors have
not yet reached the clinic.[7]
Using genomic
tools, significant progress has been made in studying AML at the
molecular level. Most AML gene expression profile (GEP) studies,
however, have been performed with the total AML mononuclear cell (MNC)
fraction.[22] Although many studies have been
published in this area, our research is the first transcriptomic
analysis to investigate beta-catenin-related genes in CD34+ cells of
AML population.
Our study has many novel features. First, we
determined beta-catenin gene expression levels in CD34+ cells isolated
from AML patients compared to the control group. Second, we found that
beta-catenin levels varied between AML patients. Third, we evaluated
transcriptional changes between AML samples (AML patient group with
high and low beta catenin levels). We showed for the first time that
the transcriptome profiles of AML samples show different molecular
signature profiles according to beta-catenin levels. Finally, we
identified genes that were differentially expressed among AML patients
grouped according to beta-catenin levels, and when these genes were
combined with genes in the control group, we identified for the first
time genes and pathways related to beta-catenin in AML.
In our
study, to identify beta-catenin-associated genes in the AML group, we
focused on 2314 genes, excluding DEGs commonly detected in the venn
diagram of the two different groups: high vs control and low vs
control. Thus, in this study, we aimed to understand the molecular
effects of the AML process by especially analysing patients with high
beta-catenin levels (high vs cont) and to identify possible
beta-catenin-related biomarkers that may be involved in disease
progression.
We also performed protein-protein interaction
networks using 2314 genes and selected 20 hub genes that are involved
in beta-catenin related AML. These hub genes included "CDC20,
KIF20A, CCNB2, CENPE, AURKA, CCNB1, PBK, TTK, DLGAP5, CENPF, MKI67,
SPAG5, NEK2, BIRC5, PTTG1, HJURP, FOXM1, HMMR, KIF14, ANLN"
which significantly enriched in cell cycle pathway. It showed that
these hub genes were significantly upregulated in patients with high
beta-catenin levels compared to controls. It was shown that the hub
genes "RSL24D1, PNO1, DIEXF, RSL1D1,
PWP1, GNL3, NMD3, DHX15, UTP23, RPS5, RPS23, RPS24, DIMT1, RPL15,
RPL37A, RPL22, RPL17-C18orf32, DDX31, TFB2M, BTF3" which showed
decreased expression, played a role in pathways such as ribosome
biogenesis and transcription factors in AML patients with high
beta-catenin levels.
The link between cancer development and
dysregulation of cellular proliferation is well documented and this is
confirmed by the growing list of genetic or transcriptional changes
affecting the main components of the cell cycle regulatory mechanisms
in malignant cells. In addition, cell cycle proteins have emerged as a
new category of potential therapeutic candidates. Many studies have
investigated the mechanisms that control the correct segregation of
sister chromatids during the final step of cell division. Cell division
cycle 20 homologue (CDC20) is
an important protein that regulates the cell cycle by controlling the
correct separation of chromosomes during mitosis. The overexpression
and/or oncogenic role of CDC20 has been reported in several human solid tumours.[23] Approximately 20% of AML patients have chromosome segregation defects due to abnormal CDC20 expression.[24] In our study, CDC20
gene expression levels were found to be higher in AML patients compared
to the control group, which is consistent with the studies in the
literature. In addition, knock down of CDC20
in colon cancer cells decreased the expression levels of beta-catenin
target genes, leading to increased phosphorylation of beta-catenin.
Thus, CDC20 is responsible for regulating Wnt/beta-catenin signalling.[25] In accordance with these data reported by Hadjihannas et al., we also found high levels of CDC20
expression in AML patients with high levels of beta catenin in our
study. Another cell cycle protein, microtubule-associated motor protein
Kinesin-like family member 20A (KIF20A)
is involved in intracellular vesicular trafficking and is necessary for
cytokinesis in cell division. KIF20A plays a role for developing of a
number of malignancies. Morita et al., indicated that the aggressive
proliferation of leukemic cells is related to the main role of KIF20A based on their findings with HL60 leukemic cells.[26] In parallel to the results of Morita et al., we also found that KIF20A expression was higher in AML patients with high levels of beta catenin as compared to controls.
The progression of the cell cycle is mainly controlled by cyclins and cyclin-dependent protein kinases (CDKs). Cyclin B1 (CCNB1),
one of the key genes in our study, is an important cell cycle regulator
protein that promotes mitosis and its aberrant expression in various
human malignancies has been associated with poor prognosis. Abnormal CCNB1 expression has been reported in the literature in the majority of human AML patients.[27] Cyclin B2 (CCNB2), a member of the cyclin family, which is also upregulated in human cancers (bladder, lung and breast),[28] was found in our study to be one of the hub genes in AML and is mainly involved in the G2/M transition.[29] Consistent with the literature, we identified increased CCNB1 and CCNB2
genes expression in AML patients with high beta-catenin levels compared
to controls. Moreover, chemotherapy resistance and the progression of
disease are significantly influenced by genes linked to mitosis. It is
yet unclear how these genes show expression and what roles they play in
drug-resistant AML patients. The researchers investigating into the
roles of the spindle assembly checkpoint (SAC) genes; CENPE, CENPF, and DLGAP5 in
chemoresistant AML patients reported that these genes were linked to a
poor prognosis and were increased in drug-resistant AML patients
compared to drug-sensitive patients.[30] In
parallel with the study by Shi et al., we found that the expression
levels of SAC genes were higher in AML patients with high beta-catenin
levels. In addition, in a study with DLGAP5,
one of the SAC genes, Chen et al., showed that in epithelial cancer
(EC) cells, DLGAP5 knockdown inactivates the Wnt/beta-catenin signaling
pathway. Furthermore, it has been demonstrated that DLGAP5 knockdown blocks the EC cells ability to proliferate by disrupting the Wnt/beta-catenin signaling pathway.[31]
In
spite of the development of treatment possibilities, AML is still the
most common haematological malignancy in terms of incidence and
cancer-related deaths.[21] It has also been known for over 15 years that beta-catenin dysregulation[15]
in AML promotes the development, protection and drug resistance of
leukaemia stem cells. Despite this knowledge, β-catenin inhibitors have
not yet reached the clinic.[7] As a member of the serine/threonine kinase family, Aurora kinase A (AURKA) controls mitosis, which is necessary for cell division. AURKA expression is significantly higher in various malignancies, including hematological malignancies.[32,33] GSK-3β is an Aurora kinase substrate.[34] In our study, AURKA
expression was analysed to be higher in AML patients with high
beta-catenin levels compared to the control group in accordance with
the literature.
The expression of the novel mitotic kinase called PDZ-binding kinase (PBK)
is dramatically downregulated during the terminal differentiation of
HL-60 leukaemia cells and elevated in hematological malignancies.[35,36] Moreover, the role of beta-catenin in promoting the aggressive result of PBK expression in vitro is significant.[37] In our study, PBK
expression levels were found to be elevated in AML patients with high
beta-catenin levels in agreement with the literature. Monopolar spindle
1 (Mps1) kinase or TTK Protein Kinase (TTK),
is the another mitotic kinase that is necessary for centrosome
duplication and chromosomal orientation at the centromere during
mitosis. Furthermore, an increasing number of study indicates that TTK is linked to a poor prognosis and malignant progression in several different cancers.[38] Furthermore, it was discovered that the mutant CTNNB1 encoding beta-catenin is a distinct predictive therapeutic response biomarker for TTK inhibitors.[39]
In our study, we found that especially in AML patients with high beta
catenin levels, the levels of expression of the TTK gene that we
associate with beta-catenin, were increased for the first time.
The cell cycle and marker of proliferation Ki-67 (MKI67)
antigen expression are strongly associated. It is nearly always
expressed throughout the mitosis in the cell cycle. When haematological
malignancies are detected, the presence of the MKI67 antigen may indicate active cell proliferation. Numerous studies investigated the expression of MKI67 in acute lymphocytic leukemia (ALL) and chronic lymphocytic leukemia (CLL), as well as the correlation between MKI67 expression and prognosis and treatment outcome. MKI67
in AML has been the subject of few investigations, and the findings of
those that have been completed have not always been accurate.[40,41] In our study, we found that MKI67 gene expression levels were higher in AML patients compared to the control group.
A
protein found on the mitotic spindle is called sperm associated antigen
5 (SPAG5). According to recent studies, it acts as an oncogene and is
overexpressed in a large number of human malignancies. Moreover, other
upstream regulators, such as GSK3β, control SPAG5.[42] According to Gu et al., patients with newly diagnosed AML had significantly higher levels of SPAG5 expression than both normal controls and patients with AML who observed complete remission.[43] Expression of SPAG5,
a beta-catenin-related gene, was found to be high in the AML patient
group with high beta-catenin levels in our study, in parallel with
previous studies. Several human malignancies exhibit aberrant
overexpression of two other proteins, NIMA-related kinase 2 (NEK2) and Human Baculoviral inhibitor of apoptosis repeat-con-taining 5 (BIRC5), which are important in the progression of the cell cycle and mitosis. Specifically, NEK2
has been found to be a gene strongly linked to drug resistance, a rapid
relapse and a poor prognosis in patients with various malignancies.[44-46] For the first time, Bai et al., demonstrated that in lung cancer cells, NEK2 knockdown can deactivate the canonical Wnt/beta-catenin signaling pathway.[47] Furthermore, the study performed by Zhou et al., shown that NEK2
enhances the potential of renal-cell carcinoma cells to proliferate,
migrate, and invade by triggering the Wnt/beta-catenin signaling
pathway.[48] Studies has indicated that in 60% of adult AML patient samples, BIRC5 expression is detected. Complex cytogenetic aberrations in adult AML patients were associated with high expression of BIRC5.[49] Additionally, it has been demonstrated that BIRC5 interacts with AURKA to inhibit GSK3β, which activates classical Wnt signaling.[50] In the course of our research, we discovered that AML patients (High vs. cont.) had higher expression levels of all 3 genes (NEK2, BIRC5, AURKA),
that control the cell cycle and related to Wnt signaling, compared to
controls. It is also known that Pituitary tumor-transforming gene 1 (PTTG1),
an oncogene also referred to as securin, regulates the G1/S and G2/M
phase transitions affecting the cell cycle. Most normal tissues have
minimal or undetectable levels of PTTG1 protein, however it is widely expressed in a variety of invasive tumors and hematopoietic malignancies.[51] Additionally, PTTG1
plays a crucial role in controlling the Wnt pathway and the development
of hepatic tumors by binding directly to beta-catenin and triggering
the transcription of Wnt target genes.[52] The results of our study were consistent with previous studies, and PTTG1 levels increased, especially in AML patients with higher beta-catenin levels in comparison to the control group.
Centromere protein A (CENP-A),
which is necessary for chromosomal segregation during mitosis and cell
cycle regulation, has Holliday junction recognition protein (HJURP) as a critical molecular chaperone. Abnormal up-regulation of HJURP
expression mediating Wnt/beta-catenin signaling is linked to poor
clinical progression and prognosis. This has been observed in a number
of human malignancies, including bladder, breast, hepatocellular (HCC),
and non-small cell lung cancer (NSCLC).[53] For the first time, we suggest that AML patients had higher expression of the beta-catenin related HJURP gene, as our study indicated.
The proliferation-associated transcription factor, Forkhead box protein M1 (FOXM1), which was named the 2010 Molecule of the Year, enhances cell proliferation. FOXM1 promotes entry into S-phase and M-phase, which accelerates the progression of the cell cycle.[54,55] Overexpression of FOXM1
has been linked to the survival of many cancer types (lung, colon,
prostate, liver, glioblastoma and blood cancers including ALL, myeloma)
and is a sign of a poor prognosis for cancer patients.[56] It has also been shown that FOXM1 expression levels in mesenchymal cells from patients affected by myeloid neoplasms play a role in promoting haematopoiesis.[57] According to recent studies, FOXM1
suppression reduced the proliferation of AML leukemia cell lines.
Furthermore, chemoresistance in AML has been discovered to be promoted
by FOXM1, however its exact molecular mechanism is still unknown. Present studies indicate that overexpression of FOXM1
increases the Wnt/beta-catenin signaling pathway by directly binding to
beta-catenin, which keeps leukemic stem cells (LSCs) quiescent and
promotes LSC self-renewal in AML.[58] Our findings were consistent with the study by Sheng et al., and analysed that FOXM1
expression was highly expressed in our AML patients. Currently, studies
has demonstrated that the cell cycle and division are affected by the
Hyaluronan-Mediated Motility Receptor (HMMR), also called CD168.
Moreover, HMMR protein has been linked to a variety of tumor types,
including sarcoma, AML, lung and breast cancers. These findings
demonstrated the critical role HMMR plays in cancer metastasis as well as the initiation and spread of malignancy.[59] We found that HMMR was significantly upregulated in AML patients with high beta-catenin levels, confirming the results of a previous studies.
Kinesin
superfamily (KIFs) proteins are essential for molecular motors that
facilitate the movement of organelles, vesicles, and chromosomes
throughout the events of meiosis and mitosis in cells. Kinesin family
member 14 (KIF14), a member of
this family of microtubule-based motor proteins that plays important
roles during cell cycle progression under basic conditions.[60]
A worse prognosis has been estimated in cases of human gastric,
epithelial ovarian, cervical, breast, and hepatocellular carcinomas
where KIF14 expression is elevated.[61] Our study is the first to identify a high level of expression of the beta-catenin-related KIF14
gene in patients with AML. This is consistent with studies in various
cancers in the literature. Another of our hub genes, Anillin (ANLN),
which is essential for cytokinesis, is elevated in the early stages of
17 cancers, and in more than ten tumors, higher expression of ANLN is associated with a poorer prognosis.[62] In our study, we found for the first time that AML patients with high levels of beta-catenin had higher expression of the ANLN gene.
Ribosome
formation is stimulated by compounds that promote cell proliferation,
even though the rate of ribosome biogenesis controls the progression of
the cell cycle.[63] Moreover, a number of genes
directly or indirectly involved in ribosome biosynthesis have their
expression controlled by Wnt signaling.[64] For the
first time, genes involved in ribosome biogenesis whose expression
levels decreased in the patient compared to the control in our study
were RSL1D1, PNO1, DIEXF, and RSL24D1,
which are thought to be beta-catenin related genes in AML but have not
been studied in the literature in the context of AML as potential
biomarkers. Ribosomal L1 domain-containing protein 1 (RSL1D1), one of the hub genes in ribosome biogenesis in our study, is a nucleolar protein that is essential in cell proliferation.[65] As shown in the study by Liu et al., RSL1D1 expression was found to be significantly increased especially in tumours from patients with colorectal cancer and high RSL1D1 expression was associated with a poorer survival in these patients.[66] On the other hand, not much research has been done on RNA-binding protein partner of NOB1 (PNO1)'s role in malignancies related to ribosomes. Numerous investigations have demonstrated the significance of PNO1 in the formation and carcinogenesis of tumor, as our study demonstrated.[67-69]
Blood-based
cancer detection may be made possible by tumour-educated platelets
(TEPs). Ge et al.'s study aimed to find diagnostic TEP genes involved
in carcinogenesis; among these TEP genes, ribosomal L24 domain
containing1 (RSL24D1), one of our study's hub genes, was identified in AML patients with high beta-catenin levels.[70] RSL24D1
alterations has been linked to developed non-small cell lung cancer,
according to a recent genome-wide methylation profile research.
The results of this study showed that, as compared to healthy
individuals, RSL24D1 was adversely related with early-stage malignancies, such as colorectal, pancreatic, hepatobiliary, lung, and breast cancers.[71]
It
is possible that new strategies for inhibiting pathways are still being
discovered because many tumors continue to carry wild-type p53
following being treated with p53 inhibitors. A new p53 inhibitor in
zebrafish was recently found to be digestive organ expansion factor (DIEXF).[72]
Periodic tryptophan protein 1, also known as endonuclein (PWP1), a nucleolar protein GNL3, and the nuclear export adaptor protein NMD3 were
found to be among the beta-catenin related genes in AML for the first
time in our study, and their expression levels were decreased in AML
patients compared to controls. Several studies show that aberrant
expression or activity of the RNA-binding protein (RBP) is a
characteristic of aggressive types of leukemia and a driver of its
progression. Although there is growing evidence that DEAH-box RNA
helicase (DHX15) plays a significant role in human malignancies, it is still not entirely understood how tumorigenesis is altered by aberrant DHX15 expression and whether it results in dysregulated RNA splicing.[73] It has been demonstrated that when AML patients have remission, DHX15 is downregulated. According to these findings, DHX15
deficiency causes DNA damage that results in cell cycle arrest and
death, which further impairs the ability of leukemia cell lines to
proliferate.[74] In our study, DHX15 expression
decreased in AML patients with high beta-catenin levels compared to the
control group, in accordance with the study by Pan et al.
Many
ribosomal proteins (RPs) have also been shown to be differentially
expressed in cancer. Both the early and late stages of colorectal
cancer were shown to overexpress RPS23. Additionally, human malignant prostate tissues were discovered to have an increased expression of RPS24.
However, in some cases of colon cancer, RPs are down-regulated. The
progression of tumors has been linked to the downregulation of RPS5 in
colon cancer. According to Yan et al., pancreatic cancer patients with
low expression of RPL15 had a worse prognosis and were at greater risk
to show cell invasion and metastasis. We found that the expression
levels of RPS23, RPS24, RPS5, and RPL15
genes, which we suggested to be related to beta-catenin and might be
biomarkers in AML, were lower in the AML patient group than in the
control group. NSCLC has been shown to have down-regulated RPL22, indicating that low expression of RPL22
could be linked to the carcinogenesis of NSCLC. Human myelodysplastic
syndrome (MDS) and AML have been reported to frequently indicate
decreased ribosomal protein RPL22 expression; this reduction is linked to worse outcomes.[75] Our research and the results of Khoury et al.'s study are consistent, and we have also found decreased RPL22 gene expression in AML patients. While Urwanisch et al., shown that AML patients had overexpressed RPL37A at the transcriptional level, our study indicated that AML patients showed decreased RPL37A expression when compared to the control group.[76]
A nucleolar protein called UTP23 Small Subunit Processome Component (UTP23) is necessary for the production of ribosomes. Studies has shown that samples of breast cancer patients express UTP23 at significantly higher levels than samples of healthy individuals, and that higher UTP23 levels are strongly correlated with a poor prognosis.[77] However, Fu et al. found that patients with ovarian cancer who had down-regulated UTP23 had a worse prognosis.[78] UTP23
gene expression decreased in our AML patients compared to the control
group, which is parallel with the findings of Fu et al., and in
contrast to Li et al. The rRNA-modifying enzyme, dimethyladenosine
transferase 1 (DIMT1) is
important in the production of ribosomes; ablation of this gene results
in the disruption of ribosome biogenesis and is fatal to human cells.
According to reported experimental results, AML cell lines were more
sensitive to DIMT1 deletion than the solid tumor cell lines that were examined. After DIMT1 eliminated, ribosome profiling of AML cells showed dysregulated transcript subsets, indicating that DIMT1 may influence a variety of cancer pathways and malignancies, including leukemia.[79] Our findings indicated that DIMT3 gene expression was lower in AML patients as compared to the control group, which is similar to results in the literature. RPL17-C18orf32,
another ribosomal protein, was decreased in AML patients with high
beta-catenin levels, compared to the control group in our study for the
first time.
Recent studies have reported high expression of various members of the DEAD box proteins (DDX) family in some cancer types.[80] The overexpression of DDX31,
a member of the DDX family linked in cellular processes involving RNA
secondary structure alterations, has been shown in both in vitro and in vivo studies to improve the migration, proliferation, and viability of pancreatic cancer cells.[81] Furthermore, it has been demonstrated that DDX31 is absent in 25% of pancreatic cancer patients.[82] Unlike Liu et al.'s study, a decrease in DDX31 gene expression was observed in our AML patients.
The expression of mitochondrial genes is influenced by genes involved in the mitochondrial transcription machinery (MTM). TFB2M,
one of the MTM genes, is increased in AML patients compared to healthy
donors, according to a single study that has been reported in the
literature. Normal cytogenetic status, NPM1 mutations, and an elevated
peripheral blood blast percentage have all been linked to upregulation
of one or more MTM genes.[83] However, in contrast to this study, in our study, TFB2M is downregulated in AML patients with high beta-catenin levels.
Basic transcription factor 3 (BTF3)
a part of the complete transcription machinery, forms a stable complex
with RNA polymerases to function as a transcriptional initiation factor
from proximal promoter sites. There is growing evidence that BTF3 regulates apoptosis and is aberrantly expressed in a variety of human malignancies, including colorectal cancers.[84] The BTF3
gene, which we identified to be associated with beta-catenin, showed a
decrease in expression in our study's AML patients for the first time.
Conclusions
In
conclusion, our study identified DEGs that are significantly associated
with poor overall survival of AML patients, both in the KEGG and GO
pathways and among hub genes. In this case, TTK, HJURP, KIF14, ELOVL6, RPL17-C18orf32, RSL1D1 and BTF3 genes
are proposed for the first time as a target gene thought to be
associated with beta-catenin in AML, and since expression differences
in these genes reduce survival rates, we can propose these genes as a
prognostic marker associated with poor prognosis. In addition, the
fatty acid elongase ELOVL6,
which is very important for haematopoietic stem cells, was the most
up-regulated gene in AML samples with high beta-catenin levels in our
study and was associated with poor prognosis in human AML patients for
the first time.
Moreover, the progression of AML disease and its
response to therapy may be significantly influenced by the cell cycle,
ribosome biogenesis, transcription factors, and lipid metabolism
pathways. For the purpose of treating AML specifically, these pathways
and genes may therefore be potential therapeutic targets.
In
brief, our results have identified potential prognostic markers for AML
and shed light on the mechanism of AML. These genes may serve as
potential targets for leukaemia, although further clinical validation
is needed in addition to our analyses.
Funding
This
study was supported by
Scientific Research Projects of Ankara University with project number
08B3330003.
Ethics
This
study was approved by
the Ankara University Faculty of Medicine ethics committee
(reference number and date: 123-3355 and 07.01.2008).
Informed consent was obtained from the
patients and healthy donors.
References
- Shipley, J. L. & Butera, J. N. Acute myelogenous leukemia. Exp Hematol 37, 649-658 (2009). https://doi.org:10.1016/j.exphem.2009.04.002
- Ilyas, M. Wnt signalling and the mechanistic basis of tumour development. J Pathol 205, 130-144 (2005). https://doi.org:10.1002/path.1692
- Frenquelli, M. & Tonon, G. WNT Signaling in Hematological Malignancies. Front Oncol 10, 615190 (2020). https://doi.org:10.3389/fonc.2020.615190
- Hayat, R., Manzoor, M. & Hussain, A. Wnt signaling pathway: A comprehensive review. Cell Biol Int 46, 863-877 (2022). https://doi.org:10.1002/cbin.11797
- Li,
X. X. et al. Overexpression of CTNNB1: Clinical implication in Chinese
de novo acute myeloid leukemia. Pathol Res Pract 214, 361-367 (2018). https://doi.org:10.1016/j.prp.2018.01.003
- Morgan,
R. G. et al. LEF-1 drives aberrant beta-catenin nuclear localization in
myeloid leukemia cells. Haematologica 104, 1365-1377 (2019). https://doi.org:10.3324/haematol.2018.202846
- Wagstaff,
M., Coke, B., Hodgkiss, G. R. & Morgan, R. G. Targeting
beta-catenin in acute myeloid leukaemia: past, present, and future
perspectives. Biosci Rep 42 (2022). https://doi.org:10.1042/BSR20211841
- Serinsoz,
E. et al. Aberrant expression of beta-catenin discriminates acute
myeloid leukaemia from acute lymphoblastic leukaemia. Br J Haematol
126, 313-319 (2004). https://doi.org:10.1111/j.1365-2141.2004.05049.x
- Simon,
M., Grandage, V. L., Linch, D. C. & Khwaja, A. Constitutive
activation of the Wnt/beta-catenin signalling pathway in acute myeloid
leukaemia. Oncogene 24, 2410-2420 (2005). https://doi.org:10.1038/sj.onc.1208431
- Ysebaert,
L. et al. Expression of beta-catenin by acute myeloid leukemia cells
predicts enhanced clonogenic capacities and poor prognosis. Leukemia
20, 1211-1216 (2006). https://doi.org:10.1038/sj.leu.2404239
- Xu,
J. et al. Clinical significance of nuclear non-phosphorylated
beta-catenin in acute myeloid leukaemia and myelodysplastic syndrome.
Br J Haematol 140, 394-401 (2008). https://doi.org:10.1111/j.1365-2141.2007.06914.x
- Chen,
C. C. et al. Prognostic significance of beta-catenin and topoisomerase
IIalpha in de novo acute myeloid leukemia. Am J Hematol 84, 87-92
(2009). https://doi.org:10.1002/ajh.21334
- Gandillet,
A. et al. Heterogeneous sensitivity of human acute myeloid leukemia to
beta-catenin down-modulation. Leukemia 25, 770-780 (2011). https://doi.org:10.1038/leu.2011.17
- Jiang,
X. et al. Disruption of Wnt/beta-Catenin Exerts Antileukemia Activity
and Synergizes with FLT3 Inhibition in FLT3-Mutant Acute Myeloid
Leukemia. Clin Cancer Res 24, 2417-2429 (2018). https://doi.org:10.1158/1078-0432.CCR-17-1556
- Han,
H. et al. Expression level and prognostic potential of
beta-catenin-interacting protein in acute myeloid leukemia. Medicine
(Baltimore) 101, e30022 (2022). https://doi.org:10.1097/MD.0000000000030022
- Livak,
K. J. & Schmittgen, T. D. Analysis of relative gene expression data
using real-time quantitative PCR and the 2 method. Methods 25, 402-408
(2001). https://doi.org:10.1006/meth.2001.1262
- Benjamini,
Y. & Cohen, R. Weighted false discovery rate controlling procedures
for clinical trials. Biostatistics 18, 91-104 (2017). https://doi.org:10.1093/biostatistics/kxw030
- Karadag
Gurel, A. & Gurel, S. To detect potential pathways and target genes
in infantile Pompe patients using computational analysis. Bioimpacts
12, 89-105 (2022). https://doi.org:10.34172/bi.2022.23467
- Karadağ
Gürel, A. & Gürel, S. Identification of novel potential molecular
targets associated with pediatric septic shock by integrated
bioinformatics analysis and validation of in vitro septic shock model.
Journal of Surgery and Medicine 6, 932-938 (2022). https://doi.org:10.28982/josam.7461
- Tang,
Z. et al. GEPIA: a web server for cancer and normal gene expression
profiling and interactive analyses. Nucleic Acids Res 45, W98-W102
(2017). https://doi.org:10.1093/nar/gkx247
- Shi,
L. et al. Analyzing the key gene expression and prognostics values for
acute myeloid leukemia. Transl Cancer Res 9, 7284-7298 (2020). https://doi.org:10.21037/tcr-20-3177
- de
Jonge, H. J. et al. Gene expression profiling in the leukemic stem
cell-enriched CD34+ fraction identifies target genes that predict
prognosis in normal karyotype AML. Leukemia 25, 1825-1833 (2011). https://doi.org:10.1038/leu.2011.172
- Xian,
F., Zhao, C. X., Huang, C., Bie, J. & Xu, G. H. The potential role
of CDC20 in tumorigenesis, cancer progression and therapy: A narrative
review. Medicine 102 (2023). https://doi.org:ARTN/e3503810.1097/MD.0000000000035038
- Bruno,
S. et al. CDC20 in and out of mitosis: a prognostic factor and
therapeutic target in hematological malignancies. J Exp Clin Canc Res
41 (2022). https://doi.org:ARTN/15910.1186/s13046-022-02363-9
- Hadjihannas,
M. V., Bernkopf, D. B., Brückner, M. & Behrens, J. Cell cycle
control of Wnt/β-catenin signalling by conductin/axin2 through CDC20.
Embo Rep 13, 347-354 (2012). https://doi.org:10.1038/embor.2012.12
- Morita,
H. et al. KIF20A, highly expressed in immature hematopoietic cells,
supports the growth of HL60 cell line. Int J Hematol 108, 607-614
(2018). https://doi.org:10.1007/s12185-018-2527-y
- Ersvaer,
E. et al. Cyclin B1 is commonly expressed in the cytoplasm of primary
human acute myelogenous leukemia cells and serves as a
leukemia-associated antigen associated with autoantibody response in a
subset of patients. Eur J Haematol 79, 210-225 (2007). https://doi.org:10.1111/j.1600-0609.2007.00899.x
- Li,
R. et al. Cyclin B2 Overexpression in Human Hepatocellular Carcinoma is
Associated with Poor Prognosis. Arch Med Res 50, 10-17 (2019). https://doi.org:10.1016/j.arcmed.2019.03.003
- Wang,
D. et al. CCNB2 is a novel prognostic factor and a potential
therapeutic target in low-grade glioma. Biosci Rep 42 (2022). https://doi.org:10.1042/BSR20211939
- Shi,
M. et al. Upregulated mitosis-associated genes CENPE, CENPF, and DLGAP5
predict poor prognosis and chemotherapy resistance of Acute Myeloid
Leukemia. Cancer Biomark 35, 11-25 (2022). https://doi.org:10.3233/CBM-203170
- Chen,
R. et al. DLGAP5 knockdown inactivates the Wnt/beta-catenin signal to
repress endometrial cancer cell malignant activities. Environ Toxicol
38, 685-693 (2023). https://doi.org:10.1002/tox.23720
- Du,
R., Huang, C., Liu, K., Li, X. & Dong, Z. Targeting AURKA in
Cancer: molecular mechanisms and opportunities for Cancer therapy. Mol
Cancer 20, 15 (2021). https://doi.org:10.1186/s12943-020-01305-3
- Kim,
S. J. et al. Aurora A kinase expression is increased in leukemia stem
cells, and a selective Aurora A kinase inhibitor enhances Ara-C-induced
apoptosis in acute myeloid leukemia stem cells. Korean J Hematol 47,
178-185 (2012). https://doi.org:10.5045/kjh.2012.47.3.178
- Shah,
K., Ahmed, M. & Kazi, J. U. The Aurora kinase/beta-catenin axis
contributes to dexamethasone resistance in leukemia. NPJ Precis Oncol
5, 13 (2021). https://doi.org:10.1038/s41698-021-00148-5
- Rapoport,
A. P., Neuman, B., Fleksher, D., Ford, T. & Nandi, A. K. Protein
Interaction Partners of PDZ-Binding Kinase (PBK) Implicate a Possible
Role in Leukemogenesis. Blood 108, 4318-4318 (2006). https://doi.org:10.1182/blood.V108.11.4318.4318
- Nandi,
A., Tidwell, M., Karp, J. & Rapoport, A. P. Protein expression of
PDZ-binding kinase is up-regulated in hematologic malignancies and
strongly down-regulated during terminal differentiation of HL-60
leukemic cells. Blood Cells Mol Dis 32, 240-245 (2004). https://doi.org:10.1016/j.bcmd.2003.10.004
- Brown-Clay,
J. D. et al. PBK/TOPK enhances aggressive phenotype in prostate cancer
via beta-catenin-TCF/LEF-mediated matrix metalloproteinases production
and invasion. Oncotarget 6, 15594-15609 (2015). https://doi.org:10.18632/oncotarget.3709
- Yu,
J., Gao, G., Wei, X. & Wang, Y. TTK Protein Kinase promotes
temozolomide resistance through inducing autophagy in glioblastoma. BMC
Cancer 22, 786 (2022). https://doi.org:10.1186/s12885-022-09899-1
- Zaman,
G. J. R. et al. TTK Inhibitors as a Targeted Therapy for CTNNB1
(beta-catenin) Mutant Cancers. Mol Cancer Ther 16, 2609-2617 (2017). https://doi.org:10.1158/1535-7163.MCT-17-0342
- Wang,
M. & Wang, L. R. [Reseach Progress of Ki-67 in Acute Myeloid
Leukemia-Review]. Zhongguo Shi Yan Xue Ye Xue Za Zhi 24, 1264-1268
(2016). https://doi.org:10.7534/j.issn.1009-2137.2016.04.057
- Sun, X. & Kaufman, P. D. Ki-67: more than a proliferation marker. Chromosoma 127, 175-186 (2018). https://doi.org:10.1007/s00412-018-0659-8
- He, J., Green, A. R., Li, Y., Chan, S. Y. T. & Liu, D. X. SPAG5: An Emerging Oncogene. Trends Cancer 6, 543-547 (2020). https://doi.org:10.1016/j.trecan.2020.03.006
- Gu,
Y. et al. Comprehensive analysis of expression as a prognostic and
predictive biomarker in acute myeloid leukemia by integrative
bioinformatics and clinical validation. Bmc Med Genomics 15 (2022). https://doi.org:ARTN/3810.1186/s12920-022-01193-0
- Fang,
Y. F. & Zhang, X. W. Targeting NEK2 as a promising therapeutic
approach for cancer treatment. Cell Cycle 15, 895-907 (2016). https://doi.org:10.1080/15384101.2016.1152430
- Zhou,
W. et al. Induces Drug Resistance Mainly through Activation of Efflux
Drug Pumps and Is Associated with Poor Prognosis in Myeloma and Other
Cancers. Cancer Cell 23, 48-62 (2013). https://doi.org:10.1016/j.ccr.2012.12.001
- Narimani,
M., Sharifi, M. & Jalili, A. Knockout Of BIRC5 Gene By CRISPR/Cas9
Induces Apoptosis And Inhibits Cell Proliferation In Leukemic Cell
Lines, HL60 And KG1. Blood Lymphat Cancer 9, 53-61 (2019). https://doi.org:10.2147/BLCTT.S230383
- Bai,
R. et al. NEK2 plays an active role in Tumorigenesis and Tumor
Microenvironment in Non-Small Cell Lung Cancer (Retracted article. See
vol. 18, pg. 3943, 2022). Int J Biol Sci 17, 1995-2008 (2021). https://doi.org:10.7150/ijbs.59019
- Zhou,
J. C., Lai, J. W., Cheng, Y. Y. & Qu, W. X. NEK2 Serves as a Novel
Biomarker and Enhances the Tumorigenicity of Clear-CellRenal-Cell
Carcinoma by Activating WNT/-Catenin Pathway. Evid-Based Compl Alt 2022
(2022). https://doi.org:Artn/189082310.1155/2022/1890823
- Greiner,
J. et al. Survivin' Acute Myeloid Leukaemia-A Personalised Target for
inv(16) Patients. International Journal of Molecular Sciences 22
(2021). https://doi.org:ARTN/1048210.3390/ijms221910482
- Mehraj,
U., Aisha, S., Sofi, S. & Mir, M. A. Expression pattern and
prognostic significance of baculoviral inhibitor of apoptosis
repeat-containing 5 (BIRC5) in breast cancer: A comprehensive analysis.
Advances in Cancer Biology - Metastasis 4 (2022). https://doi.org:10.1016/j.adcanc.2022.100037
- Chen,
P. Y. et al. Response of Myeloid Leukemia Cells to Luteolin is
Modulated by Differentially Expressed Pituitary Tumor-Transforming Gene
1 (PTTG1) Oncoprotein. Int J Mol Sci 19 (2018). https://doi.org:10.3390/ijms19041173
- Zhang,
X. et al. Phosphorylated PTTG1 switches its subcellular distribution
and promotes beta-catenin stabilization and subsequent transcription
activity. Oncogene 42, 2439-2455 (2023). https://doi.org:10.1038/s41388-023-02767-7
- Tan, J. et al. Emerging role of HJURP as a therapeutic target in cancers. Acta Materia Medica 2 (2023). https://doi.org:10.15212/amm-2023-0008
- Liao, G. B. et al. Regulation of the master regulator FOXM1 in cancer. Cell Commun Signal 16, 57 (2018). https://doi.org:10.1186/s12964-018-0266-6
- Wierstra,
I. The transcription factor FOXM1 (Forkhead box M1):
proliferation-specific expression, transcription factor function,
target genes, mouse models, and normal biological roles. Adv Cancer Res
118, 97-398 (2013). https://doi.org:10.1016/B978-0-12-407173-5.00004-2
- Khan, I. et al. FOXM1 contributes to treatment failure in acute myeloid leukemia. JCI Insight 3 (2018). https://doi.org:10.1172/jci.insight.121583
- Falconi,
G. et al. Impairment of FOXM1 expression in mesenchymal cells from
patients with myeloid neoplasms, de novo and therapy-related, may
compromise their ability to support hematopoiesis. Scientific Reports
12 (2022). https://doi.org:10.1038/s41598-022-24644-1
- Sheng, Y. et al. FOXM1 regulates leukemia stem cell quiescence and survival in MLL-rearranged AML. Nat Commun 11, 928 (2020). https://doi.org:10.1038/s41467-020-14590-9
- Ma,
X. et al. HMMR associates with immune infiltrates and acts as a
prognostic biomaker in lung adenocarcinoma. Comput Biol Med 151, 106213
(2022). https://doi.org:10.1016/j.compbiomed.2022.106213
- Wang,
Z. Z. et al. KIF14 promotes cell proliferation via activation of Akt
and is directly targeted by miR-200c in colorectal cancer. Int J Oncol
53, 1939-1952 (2018). https://doi.org:10.3892/ijo.2018.4546
- Jiang,
W. et al. KIF14 promotes proliferation, lymphatic metastasis and
chemoresistance through G3BP1/YBX1 mediated NF-kappaB pathway in
cholangiocarcinoma. Oncogene 42, 1392-1404 (2023). https://doi.org:10.1038/s41388-023-02661-2
- Cui,
Z. et al. Comprehensive bioinformatics analysis reveals the prognostic
value, predictive value, and immunological roles of ANLN in human
cancers. Front Genet 13, 1000339 (2022). https://doi.org:10.3389/fgene.2022.1000339
- Derenzini, M., Montanaro, L. & Trere, D. Ribosome biogenesis and cancer. Acta Histochem 119, 190-197 (2017). https://doi.org:10.1016/j.acthis.2017.01.009
- Dannheisig,
D. P., Bachle, J., Tasic, J., Keil, M. & Pfister, A. S. The
Wnt/beta-Catenin Pathway is Activated as a Novel Nucleolar Stress
Response. J Mol Biol 433, 166719 (2021). https://doi.org:10.1016/j.jmb.2020.11.018
- Li,
X. P. et al. Overexpression of ribosomal L1 domain containing 1 is
associated with an aggressive phenotype and a poor prognosis in
patients with prostate cancer. Oncol Lett 11, 2839-2844 (2016). https://doi.org:10.3892/ol.2016.4294
- Liu,
X. et al. RSL1D1 promotes the progression of colorectal cancer through
RAN-mediated autophagy suppression. Cell Death Dis 13, 43 (2022). https://doi.org:10.1038/s41419-021-04492-z
- Dai,
H., Zhang, S., Ma, R. & Pan, L. Celecoxib Inhibits Hepatocellular
Carcinoma Cell Growth and Migration by Targeting PNO1. Med Sci Monit
25, 7351-7360 (2019). https://doi.org:10.12659/MSM.919218
- Lin,
C. et al. Importance of PNO1 for growth and survival of urinary bladder
carcinoma: Role in core-regulatory circuitry. J Cell Mol Med 24,
1504-1515 (2020). https://doi.org:10.1111/jcmm.14835
- Liu,
D. et al. PNO1, which is negatively regulated by miR-340-5p, promotes
lung adenocarcinoma progression through Notch signaling pathway.
Oncogenesis 9, 58 (2020). https://doi.org:10.1038/s41389-020-0241-0
- Ge,
X., Yuan, L., Cheng, B. & Dai, K. Identification of seven
tumor-educated platelets RNAs for cancer diagnosis. J Clin Lab Anal 35,
e23791 (2021). https://doi.org:10.1002/jcla.23791
- Hong,
Y. et al. Epigenome-Wide Association Analysis of Differentially
Methylated Signals in Blood Samples of Patients with Non-Small-Cell
Lung Cancer. J Clin Med 8 (2019). https://doi.org:10.3390/jcm8091307
- <Loss of digestive organ expansion factor (Diexf) reveals an.pdf>.
- Guo, H. et al. RNA helicase DHX15 exemplifies a unique dependency in acute leukemia. Haematologica 108, 2029-2043 (2023). https://doi.org:10.3324/haematol.2022.282066
- <DHX15
is associated with poor prognosis in acute myeloid leukemia (AML) and
regulates cell apoptosis via the NF-kB signaling pathway.pdf>.
- El Khoury, W. & Nasr, Z. Deregulation of ribosomal proteins in human cancers. Biosci Rep 41 (2021). https://doi.org:10.1042/BSR20211577
- Urwanisch,
L. et al. The Class IIA Histone Deacetylase (HDAC) Inhibitor TMP269
Downregulates Ribosomal Proteins and Has Anti-Proliferative and
Pro-Apoptotic Effects on AML Cells. Cancers 15 (2023). https://doi.org/10.3390/cancers15041039
- Li, J. et al. (2022). https://doi.org:10.21203/rs.3.rs-2040046/v1
- Fu,
Z. et al. Down-regulation of UTP23 promotes paclitaxel resistance and
predicts poorer prognosis in ovarian cancer. Pathol Res Pract 215,
152625 (2019). https://doi.org:10.1016/j.prp.2019.152625
- Gonskikh,
Y. et al. Noncatalytic regulation of 18S rRNA methyltransferase DIMT1
in acute myeloid leukemia. Genes Dev 37, 321-335 (2023). https://doi.org:10.1101/gad.350298.122
- Abdelhaleem, M. Over-expression of RNA helicases in cancer. Anticancer Res 24, 3951-3953 (2004).
- Liu, Y., Xie, Y., Ding, J. & Wu, L. (2021). https://doi.org:10.21203/rs.3.rs-520114/v1
- Xie,
Y. J. et al. Identification of as a Potential Oncogene of Invasive
Metastasis and Proliferation in PDAC. Front Cell Dev Biol 10 (2022). https://doi.org:ARTN/76237210.3389/fcell.2022.762372
- Wu,
S., Fahmy, N. & Alachkar, H. The mitochondrial transcription
machinery genes are upregulated in acute myeloid leukemia and
associated with poor clinical outcome. Metabol Open 2, 100009 (2019). https://doi.org:10.1016/j.metop.2019.100009
- Zhou,
W. L., Yun, Z. N., Wang, T., Li, C. & Zhang, J. T. BTF3-mediated
regulation of BMI1 promotes colorectal cancer through influencing
epithelial-mesenchymal transition and stem cell-like traits. Int J Biol
Macromol 187, 800-810 (2021). https://doi.org:10.1016/j.ijbiomac.2021.07.106
Supplementary materials
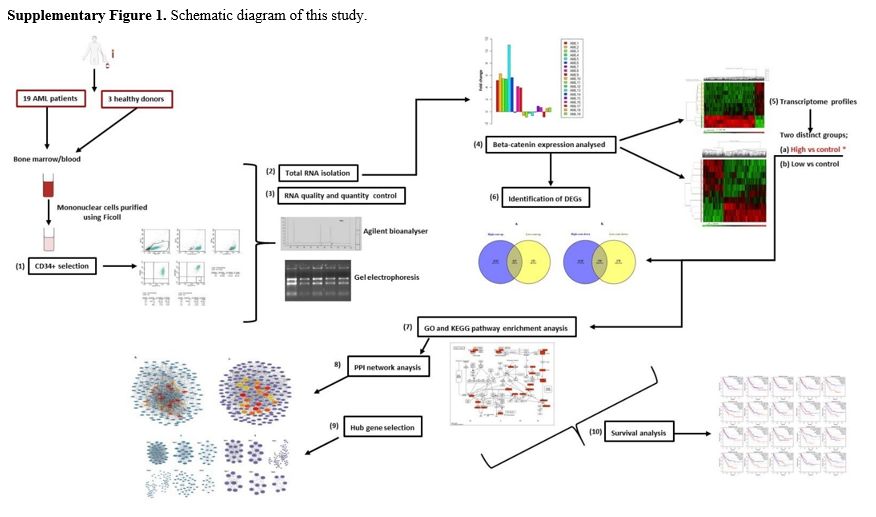 |
Supplementary Figure 1. Schematic diagram of this study. |
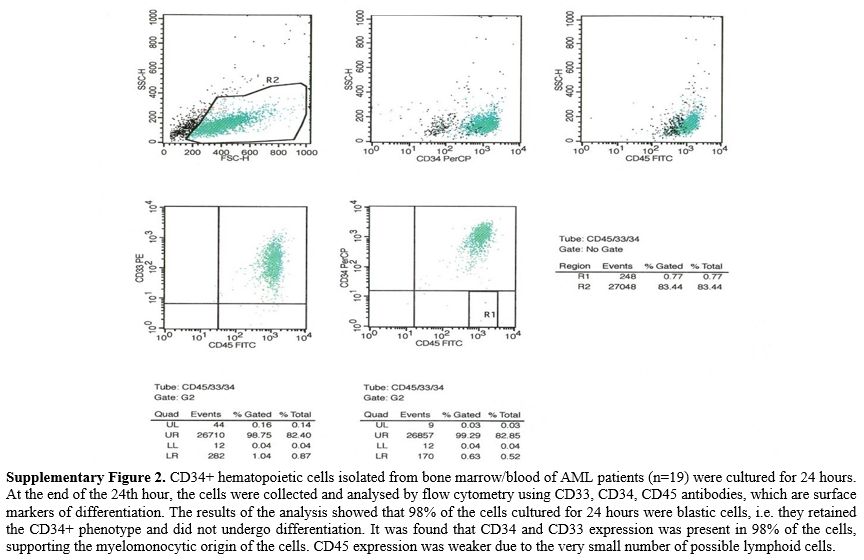 |
Supplementary Figure 2.
CD34+ hematopoietic cells isolated from bone marrow/blood of AML
patients (n=19) were cultured for 24 hours. At the end of the 24th
hour, the cells were collected and analysed by flow cytometry using
CD33, CD34, CD45 antibodies, which are surface markers of
differentiation. The results of the analysis showed that 98% of the
cells cultured for 24 hours were blastic cells, i.e. they retained the
CD34+ phenotype and did not undergo differentiation. It was found that
CD34 and CD33 expression was present in 98% of the cells, supporting
the myelomonocytic origin of the cells. CD45 expression was weaker due
to the very small number of possible lymphoid cells. |
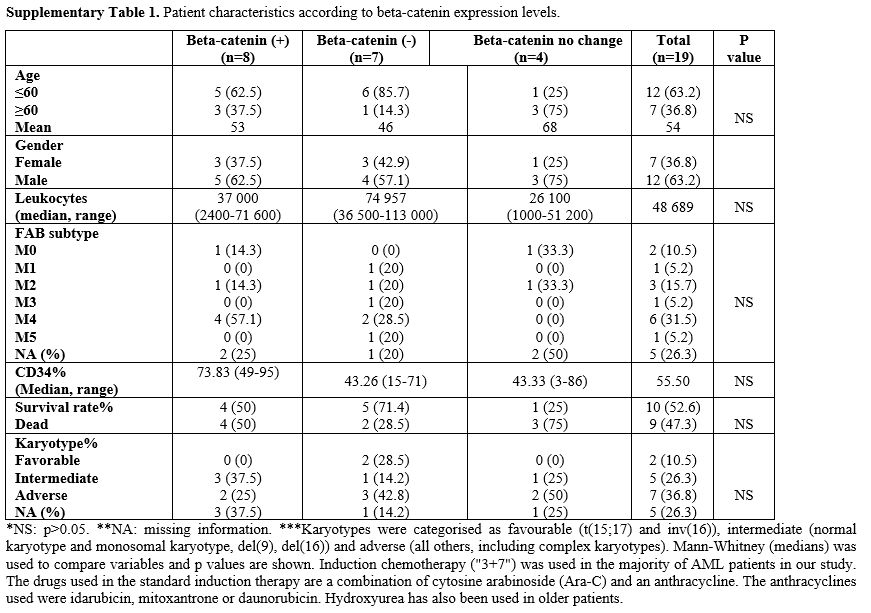 |
Supplementary Table 1. Patient characteristics according to beta-catenin expression levels. |
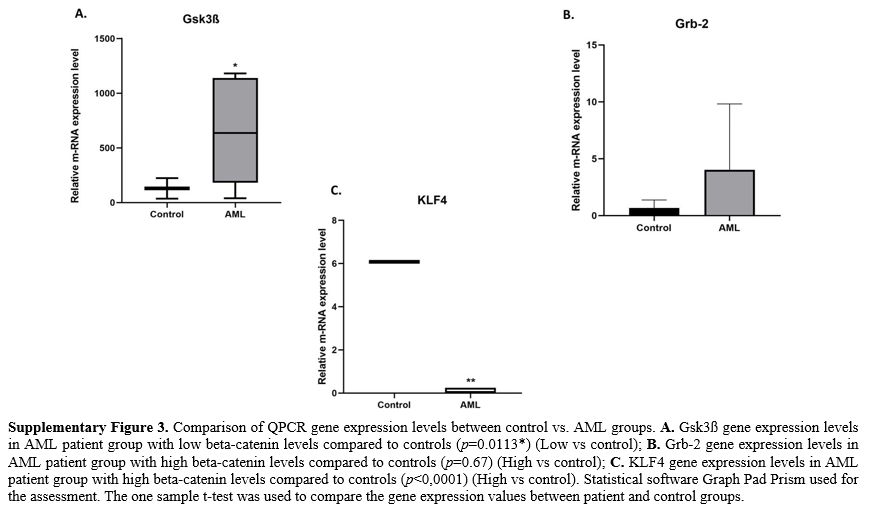 |
Supplementary Figure 3.
Comparison of QPCR gene expression levels between control vs. AML
groups. A. Gsk3ß gene expression levels in AML patient group with low
beta-catenin levels compared to controls (p=0.0113*) (Low vs control);
B. Grb-2 gene expression levels in AML patient group with high
beta-catenin levels compared to controls (p=0.67) (High vs control); C.
KLF4 gene expression levels in AML patient group with high beta-catenin
levels compared to controls (p<0,0001) (High vs control).
Statistical software Graph Pad Prism used for the assessment. The one
sample t-test was used to compare the gene expression values between
patient and control groups. |
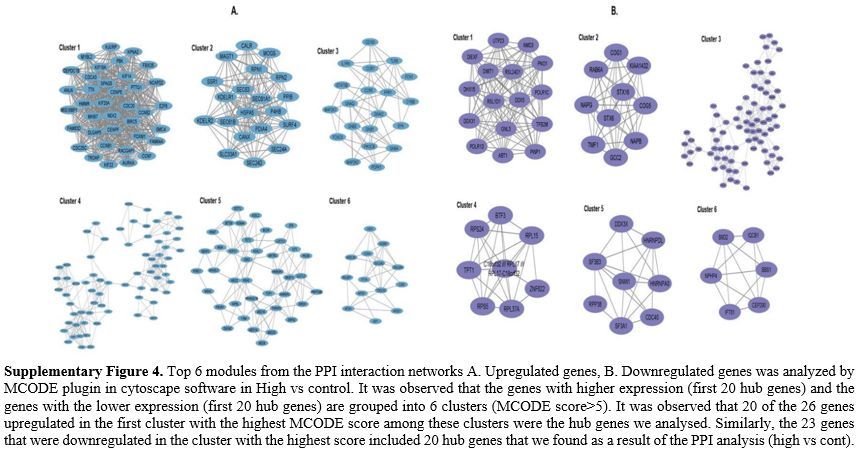 |
Supplementary Figure 4.
Top 6 modules from the PPI interaction networks A. Upregulated genes,
B. Downregulated genes was analyzed by MCODE plugin in cytoscape
software in High vs control. It was observed that the genes with higher
expression (first 20 hub genes) and the genes with the lower expression
(first 20 hub genes) are grouped into 6 clusters (MCODE score>5). It
was observed that 20 of the 26 genes upregulated in the first cluster
with the highest MCODE score among these clusters were the hub genes we
analysed. Similarly, the 23 genes that were downregulated in the
cluster with the highest score included 20 hub genes that we found as a
result of the PPI analysis (high vs cont). |
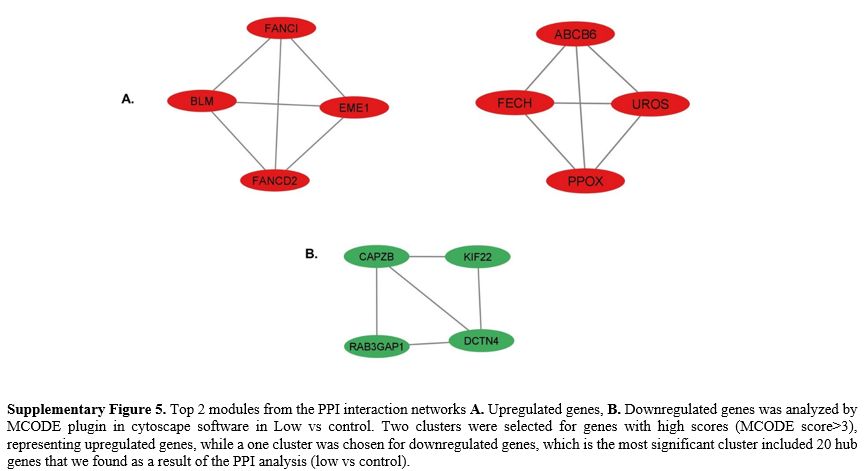 |
Supplementary Figure 5.
Top 2 modules from the PPI interaction networks A. Upregulated genes,
B. Downregulated genes was analyzed by MCODE plugin in cytoscape
software in Low vs control. Two clusters were selected for genes with
high scores (MCODE score>3), representing upregulated genes, while a
one cluster was chosen for downregulated genes, which is the most
significant cluster included 20 hub genes that we found as a result of
the PPI analysis (low vs control).
|