 |
|
Multiparametric flow cytometry (MFC) is an indispensable diagnostic tool for the detection of the pathological nature of peripheral blood (PB) lymphocytosis. While standardized MFC effectively identifies monoclonal B-cell populations through light chain restriction analysis (κ or λ),[4-6] T-cell clonality is more complex to determine and typically necessitates polymerase chain reaction (PCR)-based molecular analysis of TCR gene rearrangements.[7-9] However, T-cell clonality can also be assessed through MFC TCR-Vβ repertoire analysis. The use of anti-Vβ antibodies, targeting 24 distinct Vβ families, enables the identification of a significant part of clonal T cells by detecting expansion of a single Vβ family. Furthermore, in approximately 30% of cases, clonality can be suggested by the absence of detectable Vβ proteins, likely due to a clonal T-cell population expressing a Vβ protein outside the assay panel's coverage.[10-11] Therefore, combining MFC TCR-Vβ repertoire analysis with baseline immunophenotypic profiling is an effective strategy to pinpoint a clonal T-cell lymphocytosis, potentially eliminating the need for molecular analysis of TCR gene rearrangement assay as a first-line diagnostic approach.[11-13] A limited number of studies have explored the concordance between MFC TCR-Vβ repertoire analysis and molecular analysis of TCR gene rearrangements in identifying T-cell clonality.[14-17]
Hence, this retrospective study analyzes samples from 307 patients referred to our center for PB lymphocytosis, comparing results from MFC TCR-Vβ repertoire analysis with molecular analysis of TCR gene rearrangements (detected by PCR and DNA sequencing). The primary aim of this study is to evaluate, over a two-decade period, the concordance between these two methods in detecting T-cell clonality and assess the usefulness of MFC TCR-Vβ repertoire analysis as a first-level approach in peripheral T cell lymphoproliferative disorders.
Materials and Methods
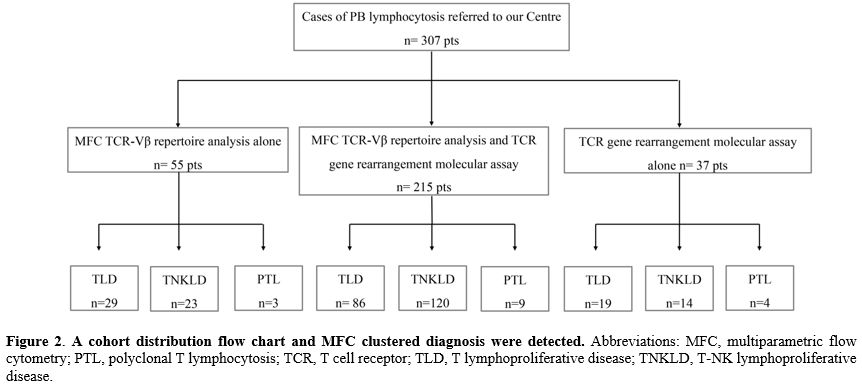
Study population. We retrospectively collected MFC data from 307 patients with peripheral T-cell lymphocytosis referred to our center at diagnosis from April 2003 to May 2024 (Figure 1).For this analysis, based on MFC findings, the diagnostic entities were categorized into T-cell lymphoproliferative diseases (TLD), T-NK lymphoproliferative diseases (T-NKLDs), and polyclonal T lymphocytosis (PTL). All 307 patients underwent MFC evaluation. In 215 patients (70%), both MFC TCR-Vβ repertoire analysis and molecular analysis of TCR gene rearrangements were performed. For 55 cases (18%), only MFC TCR-Vβ repertoire analysis was available, and in 37 patients (12%), only molecular analysis of TCR gene rearrangements was performed (Figure 2). Most of these 37 cases, lacking MFC TCR-Vβ repertoire analysis, were collected around 2003, when Vβ repertoire analysis was not routinely used in clinical practice at our institute. All patients signed the informed consent for the analysis of their samples and the use of their clinical data for scientific purposes.
 |
|
Multiparametric Flow Cytometry Analysis. The clustered immunophenotypic diagnosis was assessed by MFC using a combination of monoclonal antibodies (mAbs) recommended by the EuroFlow Consortium.[18-19] Peripheral blood (PB) samples were stained within 24 hours of collection before any treatment, including steroids. Total leukocytes cells were incubated with an appropriate volume of mAbs directed against T, NK, and B lymphoid lineage antigens (CD45, CD3, CD2, CD5, CD7, CD38, CD4, CD8, CD16, CD56, CD57, CD158a, CD158b, TCR-αβ, and TCR-γδ for the lineage T/NK and CD19, CD20, CD22, CD5, CD200, CD23, Ig λ and Ig κ light chains for the lineage B; sourced from Becton Dickinson, San Jose, CA; Società Italiana Chimici, SIC, Life Sciences, Rome, Italy; and Beckman Coulter, Brea, CA). Data on standardized 4-6-8-12 color staining combinations were acquired on FACSCalibur, FACSCanto I, FACSCanto II, or BD FACS Lyric flow cytometers (Becton Dickinson) by collecting at least 50,000 ungated events and analyzed using the Paint-A-Gate and FACSDiva software (Becton Dickinson). Cytometer setup and tracking beads (BD) were used for daily cytometer optimization. Pathological cells were gated within the total CD45+ leukocyte population, considering that all cases were positive for the pan-leukocyte antigen. Antigen expressions were measured using specific mAbs and compared with values obtained from internal negative controls, which were represented by a population of cells that do not express the antigen of interest and thus remain unlabeled in an antibody-labeled cell-suspension. These controls were exposed to identical conditions (including exposure to the antibody directed to the antigen of interest) as the cell population under investigation. Cell surface antigen expression was estimated by assessing the proportion of positive leukemic cells for each given antigen with a positivity cut-off of equal or more than 20%.
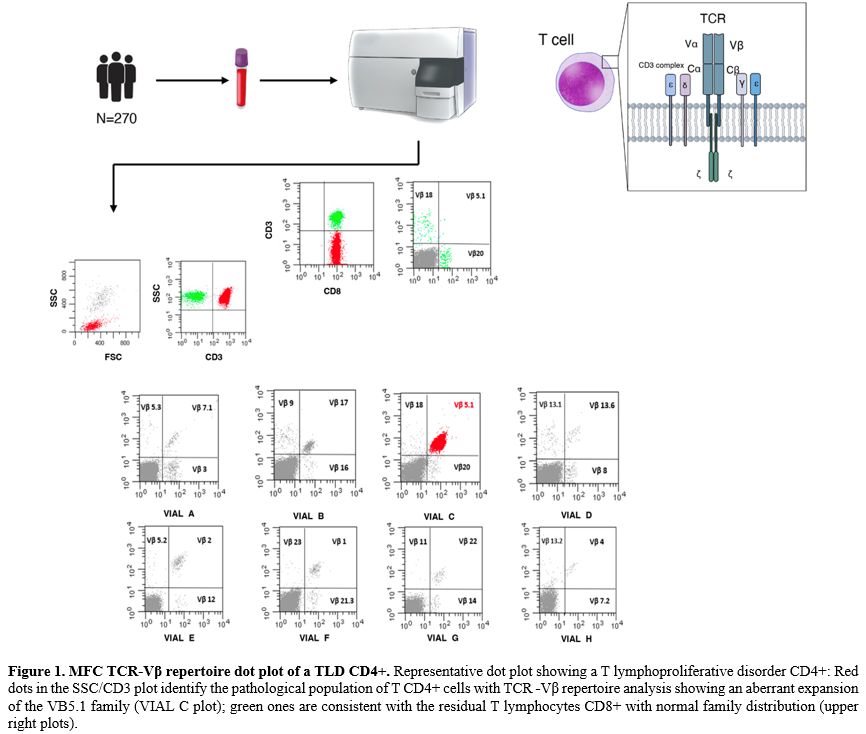
MFC TCR-Vβ repertoire analysis. Evaluation of Vβ expression was performed using the Beckman Coulter Beta Mark TCR Vbeta Repertoire Kit© according to the manufacturer's instructions. The kit is made up of 8 vials, each containing a premixed combination of three monoclonal antibodies specific for a different TCR-Vβ family (one stained with FITC, one with PE, and one with both fluorochromes), thus covering 24 TCR- Vβ antigens and about 70% of the normal human TCR- Vβ repertoire. Information on a minimum of 30.000 events was acquired for each reagent combination. Analysis was performed by gating all CD3+ positive events after CD45 lymphocyte selection on an SSC/CD45 plot. An additional gating strategy, including immunophenotypically aberrant lymphocyte subsets, was used to enhance the accuracy of TCR-Vβ repertoire analysis in cases of small lymphocyte populations. T lymphocytes were further divided into CD4+ and CD8+.
TCR-Vβ repertoire usage was assessed through 8 FITC/PE dot plots, each derived from one different test tube and showing the combination of the three moAb in the FITC, PE, and double positive quadrants. Then, the percentage value of each of the 24 families was calculated and reported on worksheet data. Data analysis was conducted using the Paint-A-Gate and FACSDiva software (Becton Dickinson).[11] Representative plots are reported in Figure 1.
Molecular analysis of TCR gene rearrangements. Genomic DNA PB samples at diagnosis were screened by Polymerase Chain Reaction (PCR) amplification using the BIOMED-2 primer sets for TCR rearrangements.[20] The products obtained from TCR rearrangements were further analyzed using heteroduplex analysis to discriminate between amplifications derived from monoclonal or polyclonal lymphoid cell populations.[21] Positive PCR products were sequenced using the Big Dye Terminator Cycle Sequencing Reaction Kit and analyzed using an automatic ABI PRISM 3130 DNA genetic analyzer (Applied Biosystems, Foster City, CA). The TCR nucleotide sequences obtained were analyzed as reported.[22,23]
Statistical analysis. The statistical methods employed in the analysis included descriptive statistics, such as the calculation of medians and ranges (minimum and maximum) for continuous variables, including age and various biological markers. Frequencies and percentages were computed for categorical variables, such as diagnostic groups and molecular rearrangements. A chi-squared test was employed to assess the association between categorical variables, with Fisher's Exact Test applied for associations with low cell counts to ensure robustness in small sample sizes. Comparative analyses were conducted to evaluate differences between groups, such as diagnostic subcategories or the presence or absence of molecular rearrangements. A significance level of p < 0.05 was adopted for all statistical tests, and all computations were performed using the R statistical software.
Results
Study population. The median age of the 307 patients included in the analysis was 64 years (range 35-90). At the time of immunophenotypic assessment, the median absolute lymphocyte count was 7.9 x 10⁹/L (range 4.0 x 10⁹/L - 224.6 x10⁹/L), and the median count of detected pathological lymphocyte count was 2.25 x 10⁹/L (1.0 x 10⁹/L - 215.6 x 10⁹/L) (Supplementary Table 1A).Overall, 286 patients (93%) expressed an αβ T-Cell Receptor phenotype (sCD3+/TCR αβ+), while 21 patients (7%) exhibited γδ T-cell receptor expression (sCD3+TCR γδ+).
Among the 286 cases expressing αβ T cell Receptor (sCD3+TCR αβ):
- In 126 (44%) patients, the conclusive diagnosis was TLDs, which were further classified as CD4+ (n=60 patients, 47.6%), CD8+ (n=55 patients, 43.7%), CD4+/CD8+ (n=8 patients, 6.3%), and CD4-/CD8- (n=3 patients, 2.4%); none of these cases expressed NK surface antigens.
- In 144 cases (50%), there was variable co-expression of NK cell antigens (CD16, CD56, CD57, CD158a, CD158b) with T-cell antigens, leading to the conclusive diagnosis of T-NKLDs. These were further classified as follows: CD8+ (n=102 patients, 70.8%); CD4+ (n=16 patients, 11.2%); CD4+/CD8+ (n=20 patients, 13.8%); CD4-/CD8- (n=6 patients, 4.2%).
- The remaining 16 cases (6%) were diagnosed as reactive T CD8+ lymphocytosis (PTLs) due to normal MFC TCR-Vβ repertoire family expression and/or polyclonal TCR gene rearrangements detected by molecular assay; of these 16 cases, the majority [nine (56%)] showed HLA-DR expression by MFC.
Among the 21 cases (7%) expressing γδ T cell Receptor (sCD3+TCR+ γδ+), eight cases (38%) were classified as TLDs, while the remaining thirteen cases (62%) were classified as T-NKLDs.
In all cases, the residual mature B cell population (CD19+/CD22+/CD20+/CD38+/CD200+) was minimal, with a median count of 0.19 x 10⁹/L (0.1 x 10⁹/L - 13.44 x 10⁹/L) and did not exhibit any κ- or λ light chain restriction or any aberrant antigen expression (Supplementary Table 1A e 1B).
MFC TCR-Vβ repertoire analysis. All 307 patients presenting with PB lymphocytosis were evaluated with an MFC analysis exploiting a wide moAbs panel that included antibodies directed against T/NK lineage antigens to highlight eventual aberrant antigen expression.
A total of 270 patients (87.9%) included in the analysis had available MFC TCR-Vβ repertoire data. In 170 cases (63%), aberrant expansion of a single TCR-Vβ repertoire family included in the kit was detected. Among all the 24 TCR-Vβ families, Vβ13.1 was the most frequently expanded in 26 patients (15.3%), followed by Vβ8 and Vβ2 in 17 patients each (10%), Vβ17 in 11 patients (6.5%), and Vβ1 in 10 patients (5.9%). Conversely, in 88 cases (32.6%), the TCR-Vβ repertoire analysis revealed the complete absence of expression for any of the TCR-Vβ repertoire families tested ("clonogram-off") (Figure 3). The clonogram displayed a “normal” plot (absence of aberrant expansion of any of the TCR-Vβ repertoire families, thus presenting a normal distribution) in all 12 patients (4.4%) with PTLs. All these cases of reactive lymphocytosis were CD8+, and more than half (9 patients, 75%) expressed HLA-DR reactivity antigen. Furthermore, when stratified by clustered diagnosis (Figure 4A and 4B), a similar frequency of expression of Vβ1, Vβ2, Vβ7.2 families and clonogram-off was noted between the TLD and T-NKLD cohorts. Although the frequency of certain MFC TCR-Vβ repertoire families was higher in one diagnostic category compared to another, no statistically significant difference was observed.
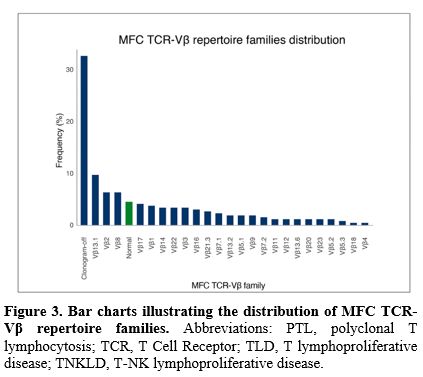 |
Figure 3. Bar charts illustrating the distribution of MFC TCR-Vβ repertoire families. Abbreviations: PTL, polyclonal T lymphocytosis; TCR, T Cell Receptor; TLD, T lymphoproliferative disease; TNKLD, T-NK lymphoproliferative disease. |
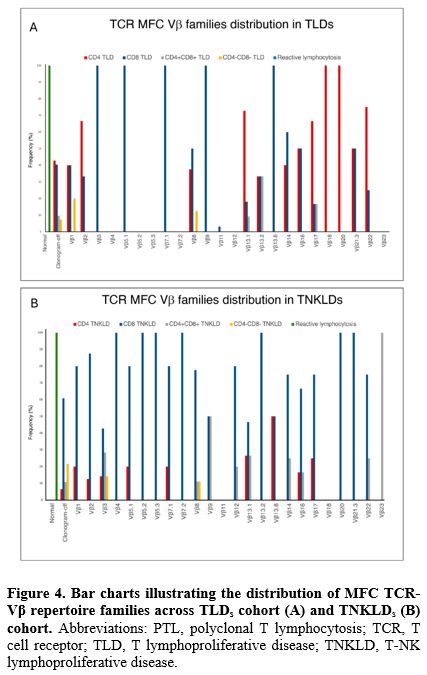 |
Figure 4. Bar charts illustrating the distribution of MFC TCR-Vβ repertoire families across TLDs cohort (A) and TNKLDs (B) cohort.
Abbreviations: PTL, polyclonal T lymphocytosis; TCR, T cell receptor;
TLD, T lymphoproliferative disease; TNKLD, T-NK lymphoproliferative
disease. |
Focusing on the 21 cases expressing TCR γδ+: in 3 patients (14.3%) MFC TCR-Vβ repertoire analysis showed pathological expansion of one family, two of which were confirmed as monoclonal by molecular analysis of TCR gene rearrangements (one sample was not available for molecular analysis); in 12 cases (57.1%) MFC TCR-Vβ repertoire analysis showed a "clonogram off" pattern and for 11 of the 12 patients (91.7%), a confirmed monoclonal restriction was evidenced by molecular analysis of TCR gene rearrangements (one sample was not available for molecular analysis); for the remaining 6 cases (28.6%) MFC TCR-Vβ repertoire analysis was not available (all cases confirmed as monoclonal by molecular analysis of TCR gene rearrangements).
Molecular analysis of TCR gene rearrangements. Overall, molecular analysis of TCR gene rearrangement assay (by PCR and DNA sequencing) was performed in 252 patients (82%). The distribution of different families’ rearrangements through the entire cohort is shown in Figure 5. The most frequent rearrangement detected by PCR was Vγ2-8Jγ1.3 in 110 patients (43.6%), followed by Vγ9Jγ1.3 in 61 patients (24.2%), Vγ 2-8Jγ 1.1 in 52 patients (20.6%), Vγ10Jγ1.3 in 42 patients (16.7%), and Vγ10-11Jγ1.3 in 26 patients (10.3%). Similarly to MFC TCR-Vβ repertoire analysis, no difference was found in the distribution of different families’ molecular rearrangement when stratified by diagnosis (Figure 6A and 6B).
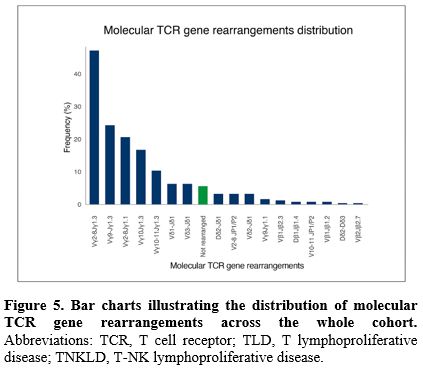 |
Figure 5. Bar charts illustrating the distribution of molecular TCR gene rearrangements across the whole cohort. Abbreviations: TCR, T cell receptor; TLD, T lymphoproliferative disease; TNKLD, T-NK lymphoproliferative disease. |
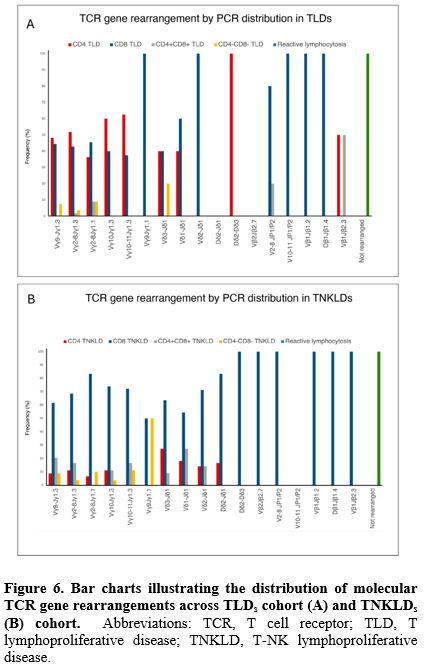 |
Figure 6. Bar charts illustrating the distribution of molecular TCR gene rearrangements across TLDs cohort (A) and TNKLDs (B) cohort. Abbreviations: TCR, T cell receptor; TLD, T lymphoproliferative disease; TNKLD, T-NK lymphoproliferative disease. |
In the 37 cases (12%) for which MFC TCR-Vβ repertoire analysis was not available, only molecular analysis of TCR gene rearrangements was performed.
Of these, four cases (10.8%) exhibited a polyclonal TCR pattern, as suggested by clinical history and baseline immunophenotyping (all cases were sCD3+/CD8+/HLA-DR+), while 33 cases (89.2%) showed monoclonal TCR rearrangement.
Interestingly, in most clonal cases, baseline MFC analysis was already highly suggestive of pathological lymphocytosis, even in the absence of the MFC TCR-Vβ repertoire analysis. In 4 cases (two sCD3+/CD8+/CD20+, one sCD3+/CD4+/CD20+, and one TCRγδ+CD20) there was the rare aberrant CD20 expression; in other 4 cases there was the lack of surface sCD3 antigen expression (sCD3-/cCD3+); in 13 cases there was the aberrant co-expression of NK antigens (CD8+/CD16+/CD56+/CD158+); in 7 cases there was the lack of CD7 antigen expression, while in other 2 cases there was the aberrant co-expression of CD4/CD8 antigens.
Correlation between MFC TCR-Vβ repertoire analysis and molecular analysis of TCR gene rearrangement. We analyzed data from 215 patients (70%) who underwent both MFC and TCR-Vβ repertoire analysis and molecular analysis of TCR gene rearrangements.
In 136 cases (63.3%), a pathological expansion of a single Vβ family was observed in the MFC TCR-Vβ repertoire analysis. Subsequent molecular analysis of TCR gene rearrangements revealed monoclonal restriction, thus confirming the flow cytometry findings.
In the other 70 cases (32.5%), the MFC TCR-Vβ repertoire analysis showed the complete absence of expression in any of the Vβ families tested (“clonogram off”), suggesting a pathological clonogram and, consequentially, pathological lymphocyte expansion, as confirmed by monoclonal restriction through molecular analysis of TCR gene rearrangements.
Although HLA-DR expression in CD8+ lymphocytes is typically suggestive of reactive processes, in eight of the 13 cases (61.5%) presenting HLA-DR antigen expression, the TCR-Vβ repertoire MFC analysis showed pathological family expansion or aberrant “clonogram-off” pattern, finding that was later confirmed by monoclonal rearrangement of the TCR gene. Conversely, the other five HLA DR+ cases (38.5%) showed a normal clonogram pattern, a finding that was later confirmed by the negativity of the TCR gene rearrangement molecular assessment.
Globally, in 9 out of 215 cases (4.2%) showing a regular distribution of Vβ families ("normal clonogram") by MFC TCR-Vβ repertoire analysis, the molecular analysis of TCR gene rearrangements confirmed the polyclonal nature of the T-cell population in all instances.
Overall, the concordance between MFC TCR-Vβ repertoire analysis and molecular analysis of TCR gene rearrangements was as high as 100% (215 out of 215 cases). In fact, both in cases where molecular analysis of TCR gene rearrangements detected clonality in T-cells and in those where such method showed the absence of clonality, these results were consistent with the results obtained from MFC TCR-Vβ repertoire analysis.
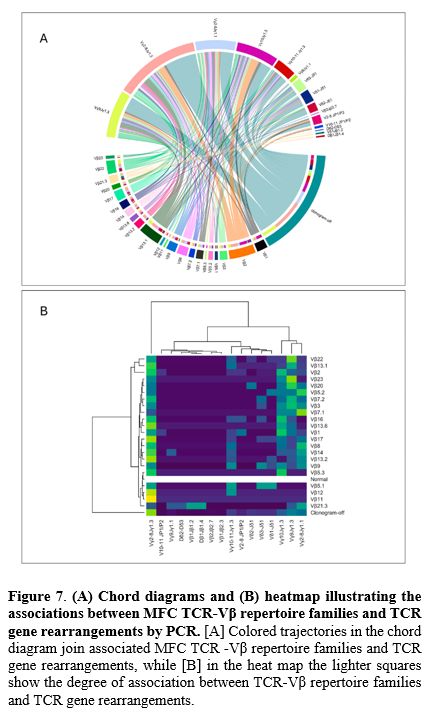
Finally, we evaluated the correlation between MFC TCR-Vβ repertoire families and molecular TCR gene rearrangement families (Figure 7). Among TCR-Vβ repertoire findings, "clonogram-off" predominantly correlated with Vγ2-8Jγ1.3 (32.1%), followed by Vγ9Jγ1.3 (15.7%), Vγ2-8Jγ1.3 (13.5%), and Vγ10Jγ1.3 (10.7%) (p<0.01). Similarly, Vβ13.1 was frequently associated with Vγ2-8Jγ1.3 (31.0%) or Vγ9Jγ1.3 (24.1%), while Vβ2 correlated primarily with Vγ2-8Jγ1.3 (29.4%) and Vγ10Jγ1.3 (26.4%) (p<0.01).
 |
|
Discussion
The pivotal aim in the diagnostic assessment of peripheral lymphocytosis is the identification of clonal populations, which allows the differentiation between reactive and pathological conditions and thereby guides clinical management. While the MFC detection of clonal B cells is currently standardized through light chain restriction, the assessment of T-cell clonality remains more complex and resource-intensive, presenting significant diagnostic challenges.The comparison of MFC TCR-Vβ repertoire analysis with alternative clonal detection techniques, such as molecular analysis of TCR gene rearrangements, represents a significant area for discussion. Although the sensitivity of MFC TCR-Vβ repertoire analysis has been explored in the literature, direct comparisons with other methodologies remain limited to small case series.[14-17] Notably, Morice et al.[15] compared MFC TCR-Vβ repertoire analysis with molecular analysis of TCR gene rearrangements (PCR and Southern blot) in 65 peripheral blood samples suspected of TLD. They identified 29 TLD cases by molecular TCR gene rearrangements assay, of which 26 showed clonality also via MFC TCR-Vβ repertoire analysis; conversely, three cases did not exhibit clonality by MFC TCR-Vβ repertoire analysis but resulted rearranged by molecular assay.
A primary challenge in the field emerges when clonality is inferred indirectly, particularly in cases where dominant MFC TCR-Vβ repertoire family expansions are not observed. In our cohort, 63.3% of cases were identified through MCF TCR-Vβ repertoire family expansion, while 32.5% were deduced based on clonogram-off profiles, consistent with previously published data.[14-16] Langerak et al.[14] reported MFC TCR-Vβ family expansion in 66% of 47 suspected TLD cases, with the remaining 16 cases (44%) showing a clonogram-off pattern and molecular analysis of TCR gene rearrangements revealing monoclonal rearrangements in all these cases.
Accordingly, all MFC TCR-Vβ pathological clonogram cases (both expansion of a single TCR-Vβ repertoire family and clonogram-off) in our study ultimately revealed an underlying clonal process when tested by molecular analysis for TCR gene rearrangements.
Our study, including 307 patients, of whom 215 underwent both MFC TCR-Vβ repertoire analysis and molecular analysis of TCR gene rearrangements, to the best of our knowledge, represents the largest of its kind to date. Various gating strategies and criteria for defining cell clonality have been proposed and employed in the literature.[10-14,20-23] Our approach predominantly focused on CD3+ populations, with a particular emphasis on immunophenotypically aberrant subsets to enhance the accuracy of MFC TCR-Vβ repertoire analysis. By carefully isolating these aberrant populations, we were able to clearly identify the restriction of individual MFC TCR-Vβ families or the presence of a clonal profile.
Most cases in our cohort were diagnosed as T- lymphoproliferative disease (TLDs and T-NKLDs), while only a few cases were polyclonal/reactive lymphocytosis (PTLs). This is probably due to the careful selection by clinicians, which led only highly suspicious cases to undergo second-level analysis. The rate of concordance between MFC TCR-Vβ repertoire analysis and molecular analysis of TCR gene rearrangements in assessing TCR clonality was high (215 out of 215 cases, 100%), confirming other experiences reported in the literature.[14-17]
Another important finding of our study that needs to be highlighted was the ability of MFC TCR-Vβ repertoire analysis to detect clonality of a T-cell population expressing antigens that are usually associated with reactive conditions, such as HLA-DR, which is often expressed on activated cytotoxic T-cells, a phenomenon previously described in conditions such as viral infections and autoimmune diseases.[24-26] Although not inherently indicative of malignancy, this expression can occasionally obscure an underlying lymphoproliferative disorder.[27] In our series, eight cases (3%) displayed a pattern of reactive lymphocytosis (sCD3+/CD8+/HLA-DR+), yet MFC analysis revealed either a dominant TCR-Vβ expansion or a clonogram-off profile, both suggestive of an underlying clonal process, which was later confirmed by molecular analysis of TCR gene rearrangements. All this highlights the importance of a thorough investigation of persistent lymphocytosis over time, as it may mask an underlying lymphoproliferative disorder (LPD) and suggests the need to add MFC TCR-Vβ repertoire mAbs in routinary MFC panels for T-cell analysis, as this could provide a rapid, cost-effective, and efficient method in detecting LPDs.
Conclusions
MFC TCR-Vβ repertoire analysis is a rapid, cheap, sensitive, and quantitative method for detecting T-cell clonality in patients with suspected T lymphoproliferative disorder.Our findings show a complete concordance between MFC TCR-Vβ repertoire analysis and molecular analysis of TCR gene rearrangements over a prolonged period of 20 years, supporting its role as an effective first-level approach test, particularly in settings where molecular assay may not be readily available.
Furthermore, the immunophenotypic study of T lymphoid populations together with MFC TCR-Vβ repertoire analysis can be complementary or used alternatively to molecular analysis of TCR gene rearrangements, serving as a reliable tool for guiding the differential diagnostic work-up toward T-cell clonal pathologies. Therefore, we reckon that the use of MFC TCR-Vβ repertoire analysis constitutes an effective first-line diagnostic approach for the detection of peripheral T-cell lymphoproliferative disorders and that it should be incorporated into standard MFC panels when a T-cell disorder is suspected.
Authors' contributions
MA and JM: Write an original draft with equal contribution. MLM and SI: flow cytometry assessment. DSI: molecular data analysis, interpretation conceptualization, investigation, formal analysis, and contribution to the writing of the original draft. VB: molecular data analysis and interpretation. MB, MGN, and SI: contribution to the laboratory work. AL: data collection, acquisition, analysis, interpretation, and review of the manuscript. AC: data collection, acquisition, analysis, and interpretation. MLB: review of the manuscript. MSDP: flow cytometry assessment; data collection, acquisition, analysis, and interpretation; conceptualization, investigation, formal analysis, and writing the original draft. MM: Supervision and manuscript editing. All authors have read and agreed to the published version of the manuscript.Data availability statement
The data that support the findings of this study are available from the corresponding author upon reasonable request.Informed consent
Written informed consent was collected according to local practice.Acknowledgments
Irene Della Starza, Maria Laura Milani, and Stefania Intoppa were supported by ROMAIL ONLUS.References
- Klein L., Kyewski B., Allen P.M., Hogquist K.A.
"Positive and negative selection of the T cell repertoire: what
thymocytes see (and don't see)." Nat Rev Immunol. 2014
Jun;14(6):377-91. doi: 10.1038/nri3667. Epub 2014 May 16. https://doi.org/10.1038/nri3667 PMid:24830344 PMCid:PMC4757912
- Venturi
V., Kedzierska K., Turner S.J., Doherty P.C., Davenport M.P. "Methods
for comparing the diversity of samples of the T cell receptor
repertoire." J Immunol Methods. 2007 Apr 10;321(1-2):182-95. doi:
10.1016/j.jim.2007.01.019. Epub 2007 Feb 21. https://doi.org/10.1016/j.jim.2007.01.019 PMid:17337271
- Yazdanifar
M., Barbarito G., Bertaina A., Airoldi I. " γδ T Cells: The Ideal Tool
for Cancer Immunotherapy." Cells. 2020 May 24;9(5):1305. doi:
10.3390/cells9051305. https://doi.org/10.3390/cells9051305 PMid:32456316 PMCid:PMC7290982
- Kroft
S.H., Harrington A.M. "Flow Cytometry of B-Cell Neoplasms." Clin Lab
Med. 2017 Dec;37(4):697-723. doi: 10.1016/j.cll.2017.07.001. Epub 2017
Aug 31. https://doi.org/10.1016/j.cll.2017.07.001 PMid:29128065
- Seegmiller
A.C., Hsi E.D., Craig F.E. "The current role of clinical flow cytometry
in the evaluation of mature B-cell neoplasms." Cytometry B Clin Cytom.
2019 Jan;96(1):20-29. doi: 10.1002/cyto.b.21756. Epub 2018 Dec 13. https://doi.org/10.1002/cyto.b.21756 PMid:30549186
- Böttcher
S., Ritgen M., Kneba M. "Flow cytometric MRD detection in selected
mature B-cell malignancies." Methods Mol Biol. 2013; 971:149-74. doi:
10.1007/978-1-62703-269-8_9. https://doi.org/10.1007/978-1-62703-269-8_9 PMid:23296963
- Craig
J.W., Dorfman D.M. "Flow Cytometry of T cells and T-cell Neoplasms."
Clin Lab Med. 2017 Dec;37(4):725-751. doi: 10.1016/j.cll.2017.07.002.
Epub 2017 Oct 3. https://doi.org/10.1016/j.cll.2017.07.002 PMid:29128066
- Mahe
E., Pugh T., Kamel-Reid S. "T cell clonality assessment: past, present
and future." J Clin Pathol. 2018 Mar;71(3):195-200. doi:
10.1136/jclinpath-2017-204761. Epub 2017 Oct 21. Erratum in: J Clin
Pathol. 2018 Jul;71(7):660. https://doi.org/10.1136/jclinpath-2017-204761 PMid:29055897 PMCid:PMC5868531
- Mendoza
H., Tormey C.A., Rinder H.M., Howe J.G., Siddon A.J. "The utility and
limitations of B- and T-cell gene rearrangement studies in evaluating
lymphoproliferative disorders." Pathology. 2021 Feb;53(2):157-165. doi:
10.1016/j.pathol.2020.09.024. Epub 2020 Dec 25. https://doi.org/10.1016/j.pathol.2020.09.024 PMid:33358756
- Beck
R.C., Stahl S., O'Keefe C.L., Maciejewski J.P., Theil K.S., Hsi E.D.
"Detection of mature T-cell leukemias by flow cytometry using
anti-T-cell receptor V beta antibodies." Am J Clin Pathol. 2003
Nov;120(5):785-94. doi: 10.1309/835B-04QX-GNNF-NRJU. https://doi.org/10.1309/835B-04QX-GNNF-NRJU PMid:14608907
- Peruzzi
B., Bencini S., Caporale R. "TCR Vβ Evaluation by Flow Cytometry."
Methods Mol Biol. 2021; 2285:99-109. doi:
10.1007/978-1-0716-1311-5_8. https://doi.org/10.1007/978-1-0716-1311-5_8 PMid:33928546
- Lima
M., Almeida J., Santos A.H., dos Anjos Teixeira M., Alguero M.C.,
Queirós M.L., Balanzategui A., Justiça B., Gonzalez M., San Miguel
J.F., Orfão A. "Immunophenotypic analysis of the TCR-Vbeta repertoire
in 98 persistent expansions of CD3(+)/TCR-alphabeta(+) large granular
lymphocytes: utility in assessing clonality and insights into the
pathogenesis of the disease." Am J Pathol. 2001 Nov;159(5):1861-8. doi:
10.1016/s0002-9440(10)63032-5. https://doi.org/10.1016/S0002-9440(10)63032-5 PMid:11696446
- Feng
B., Jorgensen J.L., Hu Y., Medeiros L.J., Wang S.A. "TCR-Vbeta flow
cytometric analysis of peripheral blood for assessing clonality and
disease burden in patients with T cell large granular lymphocyte
leukaemia." J Clin Pathol. 2010 Feb;63(2):141-6. doi:
10.1136/jcp.2009.069336. https://doi.org/10.1136/jcp.2009.069336 PMid:20154036
- Langerak
A.W., van Den Beemd R., Wolvers-Tettero I.L., Boor P.P., van Lochem
E.G., Hooijkaas H., van Dongen J.J. "Molecular and flow cytometric
analysis of the Vbeta repertoire for clonality assessment in mature
TCRalphabeta T-cell proliferations." Blood. 2001 Jul 1;98(1):165-73.
doi: 10.1182/blood. v98.1.165. PMID: 11418476. https://doi.org/10.1182/blood.V98.1.165 PMid:11418476
- Morice
W.G., Kimlinger T., Katzmann J.A., Lust J.A., Heimgartner P.J., Halling
K.C., Hanson C.A. "Flow cytometric assessment of TCR-Vbeta expression
in the evaluation of peripheral blood involvement by T-cell
lymphoproliferative disorders: a comparison with conventional T-cell
immunophenotyping and molecular genetic techniques." Am J Clin Pathol.
2004 Mar;121(3):373-83. doi: 10.1309/3A32-DTVM-H640-M2QA. https://doi.org/10.1309/3A32-DTVM-H640-M2QA
- Qiu
Z.Y., Shen W.Y., Fan L., Wang L., Yu H., Qiao C., Wu Y.J., Lu R.N.,
Qian J., He G.S., Xu W., Li J.Y. "Assessment of clonality in T-cell
large granular lymphocytic leukemia: flow cytometric T cell receptor Vβ
repertoire and T cell receptor gene rearrangement." Leuk Lymphoma. 2015
Feb;56(2):324-31. doi: 10.3109/10428194.2014.921297. Epub 2014 Jul 17. https://doi.org/10.3109/10428194.2014.921297 PMid:24828862
- Hsieh
Y.C., Chang S.T., Huang W.T., Kuo S.Y., Chiang T.A., Chuang S.S. "A
comparative study of flow cytometric T cell receptor Vβ repertoire and
T cell receptor gene rearrangement in the diagnosis of large granular
lymphocytic lymphoproliferation." Int J Lab Hematol. 2013
Oct;35(5):501-9. doi: 10.1111/ijlh.12041. Epub 2013 Jan 3. https://doi.org/10.1111/ijlh.12041 PMid:23286298
- van
Dongen J.J., Lhermitte L., Böttcher S., Almeida J., van der Velden
V.H., Flores-Montero J., Rawstron A., Asnafi V., Lécrevisse Q., Lucio
P., Mejstrikova E., Szczepański T., Kalina T., de Tute R., Brüggemann
M., Sedek L., Cullen M., Langerak A.W., Mendonça A., Macintyre E.,
Martin-Ayuso M., Hrusak O., Vidriales M.B., Orfao A.; EuroFlow
Consortium (EU-FP6, LSHB-CT-2006-018708). " EuroFlow antibody panels
for standardized n-dimensional flow cytometric immunophenotyping of
normal, reactive and malignant leukocytes." Leukemia. 2012
Sep;26(9):1908-75. doi: 10.1038/leu.2012.120. Epub 2012 May 3. https://doi.org/10.1038/leu.2012.120 PMid:22552007 PMCid:PMC3437410
- Orfao
A., Matarraz S., Pérez-Andrés M., Almeida J., Teodosio C., Berkowska
M.A., van Dongen J.J.M.; EuroFlow. "Immunophenotypic dissection of
normal hematopoiesis." J Immunol Methods. 2019 Dec; 475:112684. doi:
10.1016/j.jim.2019.112684. Epub 2019 Oct 30. https://doi.org/10.1016/j.jim.2019.112684 PMid:31676343
- van
Dongen J.J., Langerak A.W., Brüggemann M., Evans P.A., Hummel M.,
Lavender F.L., Delabesse E., Davi F., Schuuring E., García-Sanz R., van
Krieken J.H., Droese J., González D., Bastard C., White H.E.,
Spaargaren M., González M., Parreira A., Smith J.L., Morgan G.J., Kneba
M., Macintyre E.A. " Design and standardization of PCR primers and
protocols for detection of clonal immunoglobulin and T-cell receptor
gene recombinations in suspect lymphoproliferation: report of the
BIOMED-2 Concerted Action BMH4-CT98-3936." Leukemia. 2003
Dec;17(12):2257-317. doi: 10.1038/sj.leu.2403202. https://doi.org/10.1038/sj.leu.2403202 PMid:14671650
- Langerak
A.W., Szczepański T., van der Burg M., Wolvers-Tettero I.L., van Dongen
J.J. "Heteroduplex PCR analysis of rearranged T cell receptor genes for
clonality assessment in suspect T cell proliferations." Leukemia. 1997
Dec;11(12):2192-9. doi: 10.1038/sj.leu.2400887. https://doi.org/10.1038/sj.leu.2400887 PMid:9447840
- Brochet
X., Lefranc M.P., Giudicelli V. "IMGT/V-QUEST: the highly customized
and integrated system for IG and TR standardized V-J and V-D-J sequence
analysis." Nucleic Acids Res. 2008 Jul 1;36(Web Server issue): W503-8.
doi: 10.1093/nar/gkn316. Epub 2008 May 24. https://doi.org/10.1093/nar/gkn316 PMid:18503082 PMCid:PMC2447746
- Lefranc
M.P., Giudicelli V., Ginestoux C., Bodmer J., Müller W., Bontrop R.,
Lemaitre M., Malik A., Barbié V., Chaume D. "IMGT, the international
ImMunoGeneTics database." Nucleic Acids Res. 1999 Jan 1;27(1):209-12.
doi: 10.1093/nar/27.1.209. https://doi.org/10.1093/nar/27.1.209 PMid:9847182 PMCid:PMC148137
- Sáez-Cirión
A., Lacabaratz C., Lambotte O., Versmisse P., Urrutia A., Boufassa F.,
Barré-Sinoussi F., Delfraissy J.F., Sinet M., Pancino G., Venet A.;
Agence Nationale de Recherches sur le Sida EP36 HIV Controllers Study
Group. "HIV controllers exhibit potent CD8 T cell capacity to suppress
HIV infection ex vivo and peculiar cytotoxic T lymphocyte activation
phenotype." Proc Natl Acad Sci U S A. 2007 Apr 17;104(16):6776-81. doi:
10.1073/pnas.0611244104. Epub 2007 Apr 11. https://doi.org/10.1073/pnas.0611244104 PMid:17428922 PMCid:PMC1851664
- Viallard
J.F., Blanco P., André M., Etienne G., Liferman F., Neau D., Vidal E.,
Moreau J.F., Pellegrin J.L. "CD8+HLA-DR+ T lymphocytes are increased in
common variable immunodeficiency patients with impaired memory B-cell
differentiation." Clin Immunol. 2006 Apr;119(1):51-8. doi:
10.1016/j.clim.2005.11.011. Epub 2006 Jan 18. https://doi.org/10.1016/j.clim.2005.11.011 PMid:16413828
- Viallard
J.F., Bloch-Michel C., Neau-Cransac M., Taupin J.L., Garrigue S.,
Miossec V., Mercie P., Pellegrin J.L., Moreau J.F. "HLA-DR expression
on lymphocyte subsets as a marker of disease activity in patients with
systemic lupus erythematosus." Clin Exp Immunol. 2001
Sep;125(3):485-91. doi: 10.1046/j.1365-2249.2001.01623.x. https://doi.org/10.1046/j.1365-2249.2001.01623.x PMid:11531958 PMCid:PMC1906149
- Sidorova Y.V., Sychevskaya K.A., Chernova N.G., Julhakyan H.L., Smirnova S.J., Ryzhikova N.V., Gorodetskiy V.R., Naumova E.V., Sudarikov A.B. "High Incidence of Clonal CD8+ T-cell Proliferation in Non-malignant Conditions May Reduce the Significance of T-cell Clonality Assay for Differential Diagnosis in Oncohematology." Clin Lymphoma Myeloma Leuk. 2020 Apr;20(4):203-208. doi: 10.1016/j.clml.2019.12.021. Epub 2020 Jan 8. https://doi.org/10.1016/j.clml.2019.12.021 PMid:32046930
Supplementary files
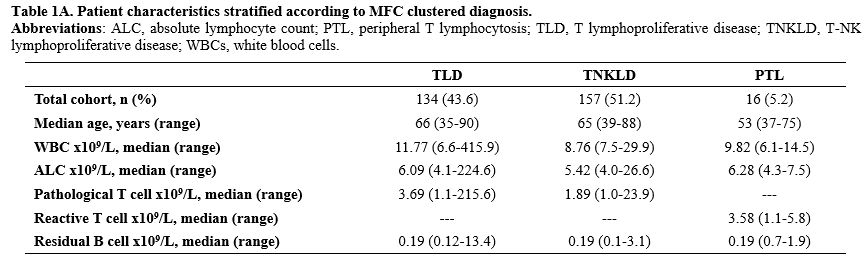 |
Table 1A. Patient characteristics stratified according to MFC clustered diagnosis. Abbreviations: ALC, absolute lymphocyte count; PTL, peripheral T lymphocytosis; TLD, T lymphoproliferative disease; TNKLD, T-NK lymphoproliferative disease; WBCs, white blood cells. |
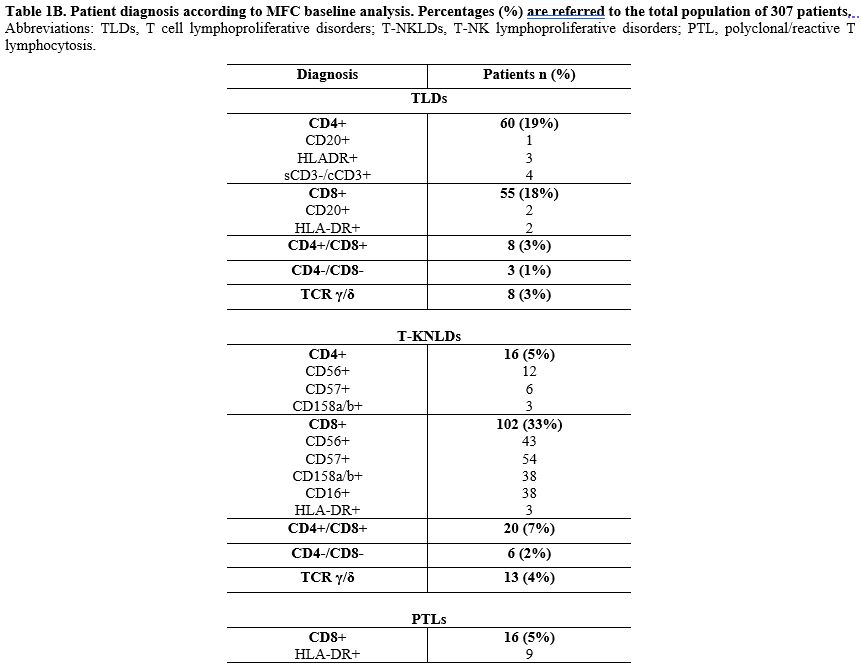 |
Table 1B. Patient
diagnosis according to MFC baseline analysis. Percentages (%) are
referred to the total population of 307
patients. Abbreviations: TLDs, T cell lymphoproliferative disorders; T-NKLDs, T-NK lymphoproliferative disorders; PTL, polyclonal/reactive T lymphocytosis. |